Technical Analysis of ITAN 2024-05-10
Overview:
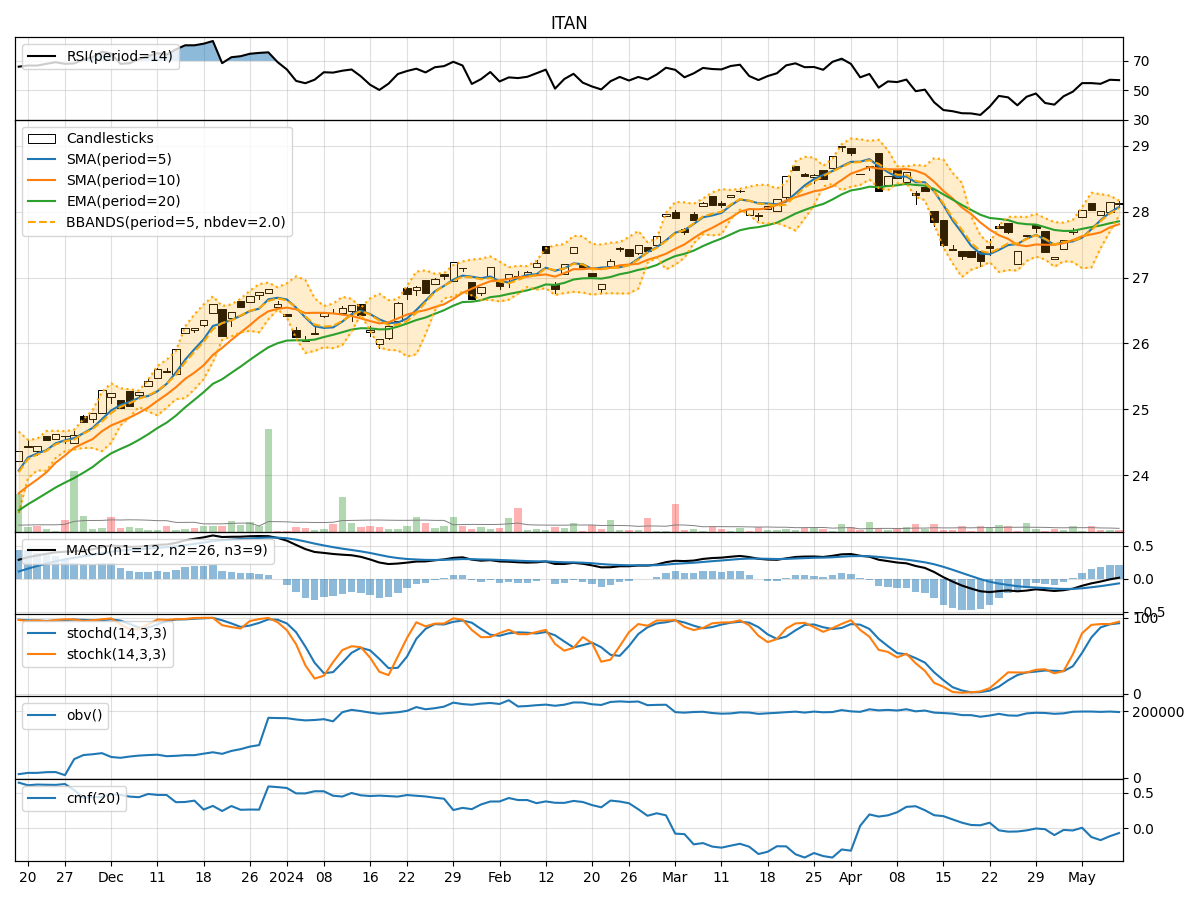
In the last 5 trading days, the stock of ITAN has shown relatively stable price movements with minor fluctuations. The technical indicators across trend, momentum, volatility, and volume provide valuable insights into the stock's potential future price movements. Let's analyze each category of indicators to determine the possible stock price movement in the next few days.
Trend Analysis:
- Moving Averages (MA): The 5-day Moving Average (MA) has been consistently above the Simple Moving Average (SMA) and Exponential Moving Average (EMA), indicating a short-term uptrend.
- MACD: The MACD line has been above the signal line, suggesting bullish momentum.
- RSI: The Relative Strength Index (RSI) has been fluctuating around the neutral zone, indicating a balanced market sentiment.
Momentum Analysis:
- Stochastic Oscillator: Both %K and %D values have been in the overbought zone, suggesting a potential reversal or consolidation.
- Williams %R: The Williams %R indicator has been hovering around the oversold territory, indicating a possible buying opportunity.
Volatility Analysis:
- Bollinger Bands (BB): The stock price has been trading within the Bollinger Bands, with the bands narrowing, indicating reduced volatility.
- BB %B: The %B indicator has been relatively stable, suggesting a lack of extreme price movements.
Volume Analysis:
- On-Balance Volume (OBV): The OBV has shown a slight decrease, indicating some distribution of the stock.
- Chaikin Money Flow (CMF): The CMF has been negative, reflecting selling pressure in the stock.
Key Observations:
- The stock is currently in a short-term uptrend based on moving averages and MACD.
- Momentum indicators suggest a potential reversal or consolidation in the near term.
- Volatility is decreasing, indicating a possible period of consolidation.
- Volume indicators show a slight distribution of the stock.
Conclusion:
Based on the analysis of technical indicators, the stock of ITAN is likely to experience sideways movement or consolidation in the next few days. Traders may expect the stock price to trade within a narrow range with limited upside or downside potential. It is advisable to closely monitor key support and resistance levels for potential breakout opportunities.