Technical Analysis of ISPY 2024-05-10
Overview:
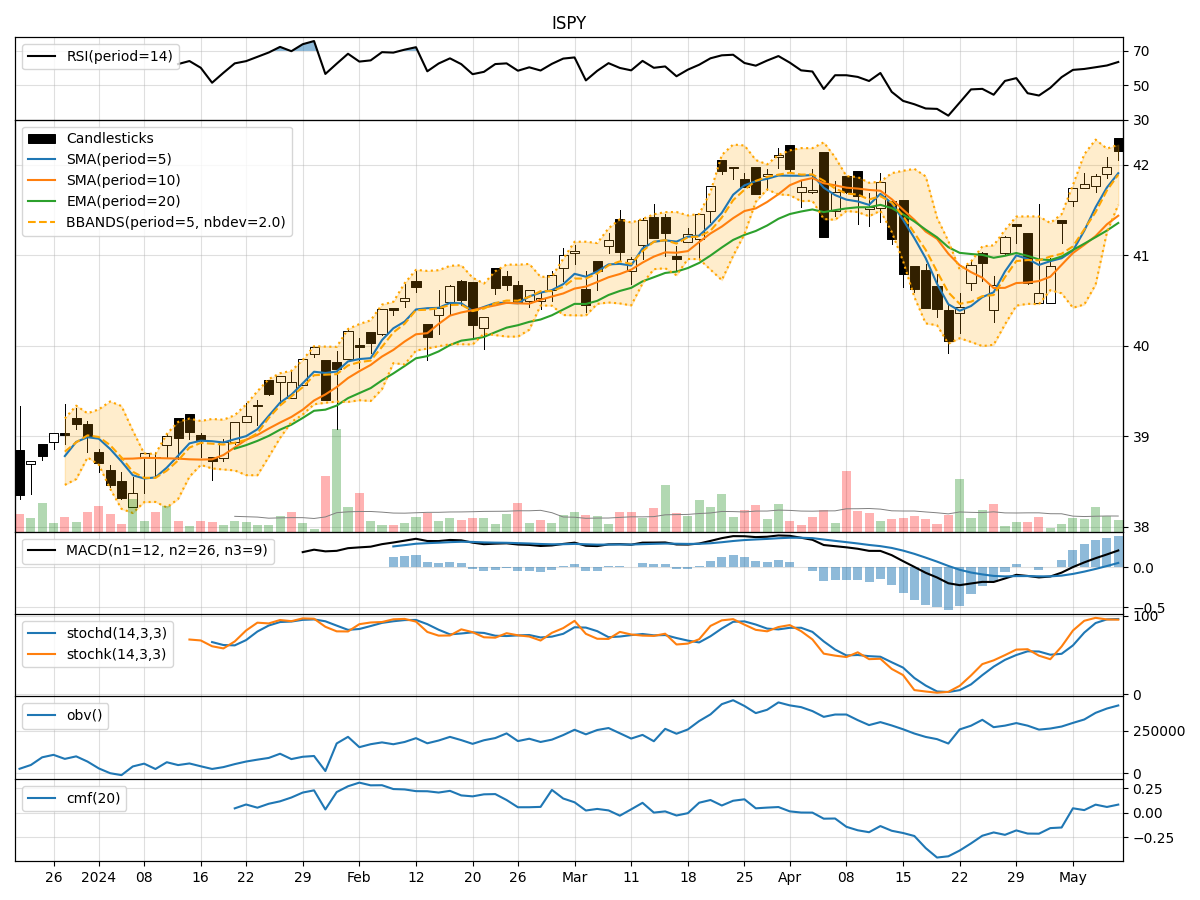
In the last 5 trading days, ISPY stock has shown a consistent uptrend in both price and volume. The moving averages have been trending upwards, indicating a bullish sentiment. Momentum indicators like RSI and Stochastic oscillators suggest the stock is in overbought territory but still showing strength. Volatility indicators show a narrowing of the Bollinger Bands, indicating potential consolidation. Volume indicators have been positive, with increasing On-Balance Volume (OBV) and Chaikin Money Flow (CMF) values.
Trend Analysis:
- Moving Averages (MA): The 5-day MA has been consistently above the 10-day SMA, indicating short-term bullish momentum. The EMA(20) is also trending upwards, supporting the bullish trend.
- MACD: The MACD line has been above the signal line for the past 5 days, showing positive momentum. The MACD Histogram has been increasing, indicating strengthening bullish momentum.
Momentum Analysis:
- RSI: The RSI has been in the overbought zone, suggesting a potential pullback or consolidation in the near term.
- Stochastic Oscillators: Both %K and %D have been in the overbought region, indicating a possible reversal or correction.
Volatility Analysis:
- Bollinger Bands (BB): The narrowing of the Bollinger Bands suggests decreasing volatility and a potential period of consolidation. The price has been trading within the bands, indicating a balanced market.
Volume Analysis:
- On-Balance Volume (OBV): The increasing OBV suggests that buyers have been more active in the last 5 days, supporting the upward price movement.
- Chaikin Money Flow (CMF): The rising CMF indicates that money flow has been positive, aligning with the bullish trend.
Conclusion:
Based on the technical indicators analyzed: - Trend: The stock is in a strong upward trend. - Momentum: While momentum indicators suggest overbought conditions, the overall trend remains bullish. - Volatility: The narrowing Bollinger Bands indicate a potential period of consolidation. - Volume: Increasing OBV and CMF values support the bullish sentiment.
Forecast:
Given the current technical analysis, the next few days for ISPY stock are likely to see sideways consolidation or a minor pullback due to overbought conditions. However, the overall trend remains bullish. Traders may consider taking profits or waiting for a better entry point during a potential pullback. Long-term investors can continue to hold their positions, considering the strong trend and positive volume indicators.