Technical Analysis of IPDP 2024-05-10
Overview:
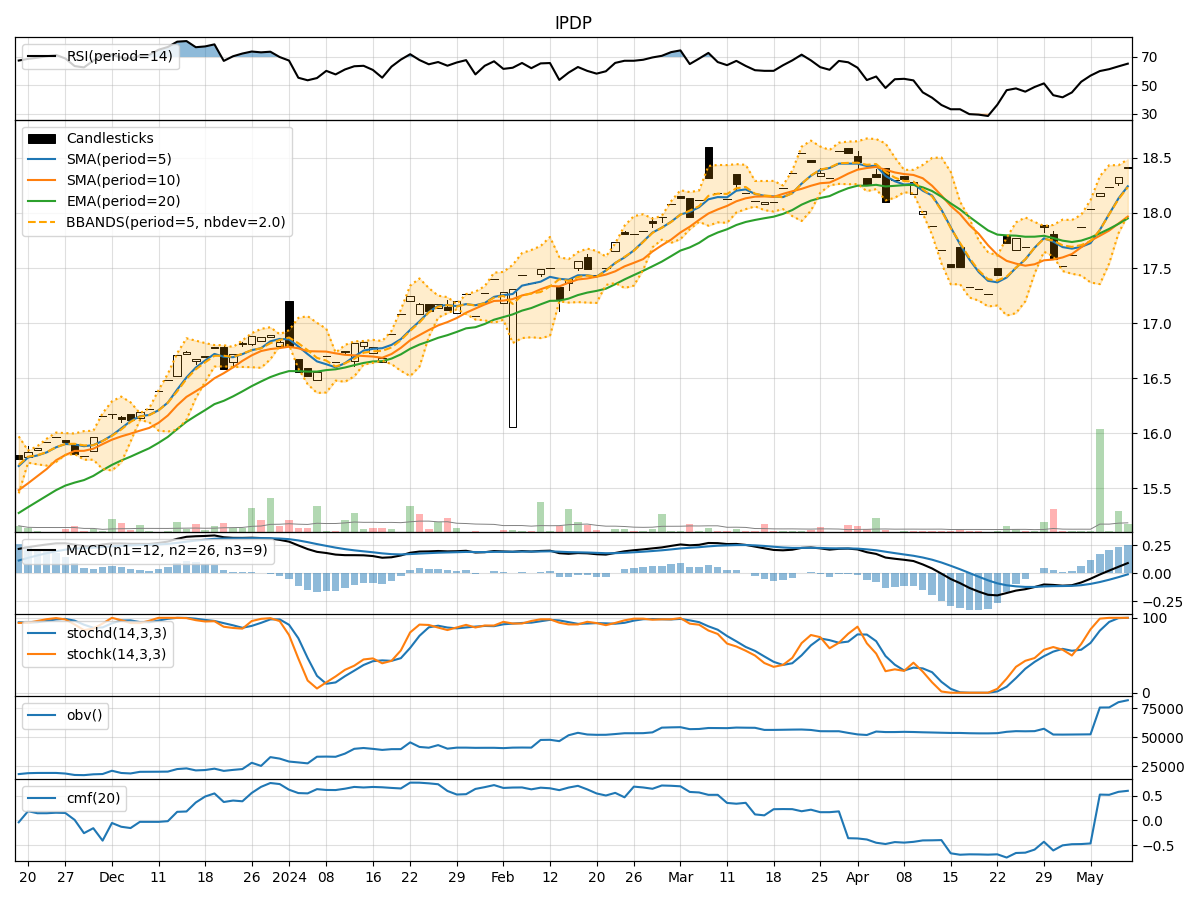
In analyzing the technical indicators for the stock with the ticker symbol IPDP over the last 5 days, we will delve into the trend, momentum, volatility, and volume indicators to provide a comprehensive outlook on the possible stock price movement in the coming days.
Trend Analysis:
- Moving Averages (MA): The 5-day Moving Average (MA) has been consistently rising, indicating a bullish trend in the short term.
- MACD: The Moving Average Convergence Divergence (MACD) has been positive and increasing, suggesting upward momentum.
- EMA: The Exponential Moving Average (EMA) has also been on an upward trajectory, supporting the bullish trend.
Momentum Analysis:
- RSI: The Relative Strength Index (RSI) has been increasing, showing strengthening momentum.
- Stochastic Oscillator: Both %K and %D have been at 100%, indicating strong buying pressure.
- Williams %R: The Williams %R is at 0.0, signaling an overbought condition.
Volatility Analysis:
- Bollinger Bands (BB): The stock price has been trading near the upper Bollinger Band, suggesting high volatility.
- BB Width: The Bollinger Band Width has been narrowing, indicating a potential decrease in volatility.
- BB %B: The %B is above 0.8, indicating the stock is trading at the upper range of volatility.
Volume Analysis:
- On-Balance Volume (OBV): The OBV has been steadily increasing, reflecting strong buying volume.
- Chaikin Money Flow (CMF): The CMF has been positive for the last 20 days, indicating accumulation by investors.
Key Observations:
- The stock is in a strong bullish trend based on moving averages, MACD, and EMA.
- Momentum indicators like RSI and Stochastic Oscillator suggest overbought conditions.
- Volatility has been high but may see a decrease based on Bollinger Bands analysis.
- Volume indicators show consistent buying pressure and accumulation by investors.
Conclusion:
Based on the analysis of technical indicators, the stock of IPDP is overbought and trading at the upper range of volatility. While the bullish trend is strong, there is a possibility of a short-term pullback or consolidation due to the overbought conditions. Traders should exercise caution and consider taking profits or implementing risk management strategies in anticipation of a potential correction in the stock price.