Technical Analysis of INC 2024-05-10
Overview:
In analyzing the technical indicators for INC stock over the last 5 days, we will delve into the trend, momentum, volatility, and volume indicators to provide a comprehensive outlook on the possible stock price movement in the coming days. By examining key metrics such as moving averages, MACD, RSI, Bollinger Bands, and OBV, we aim to offer valuable insights and predictions for potential price trends.
Trend Indicators:
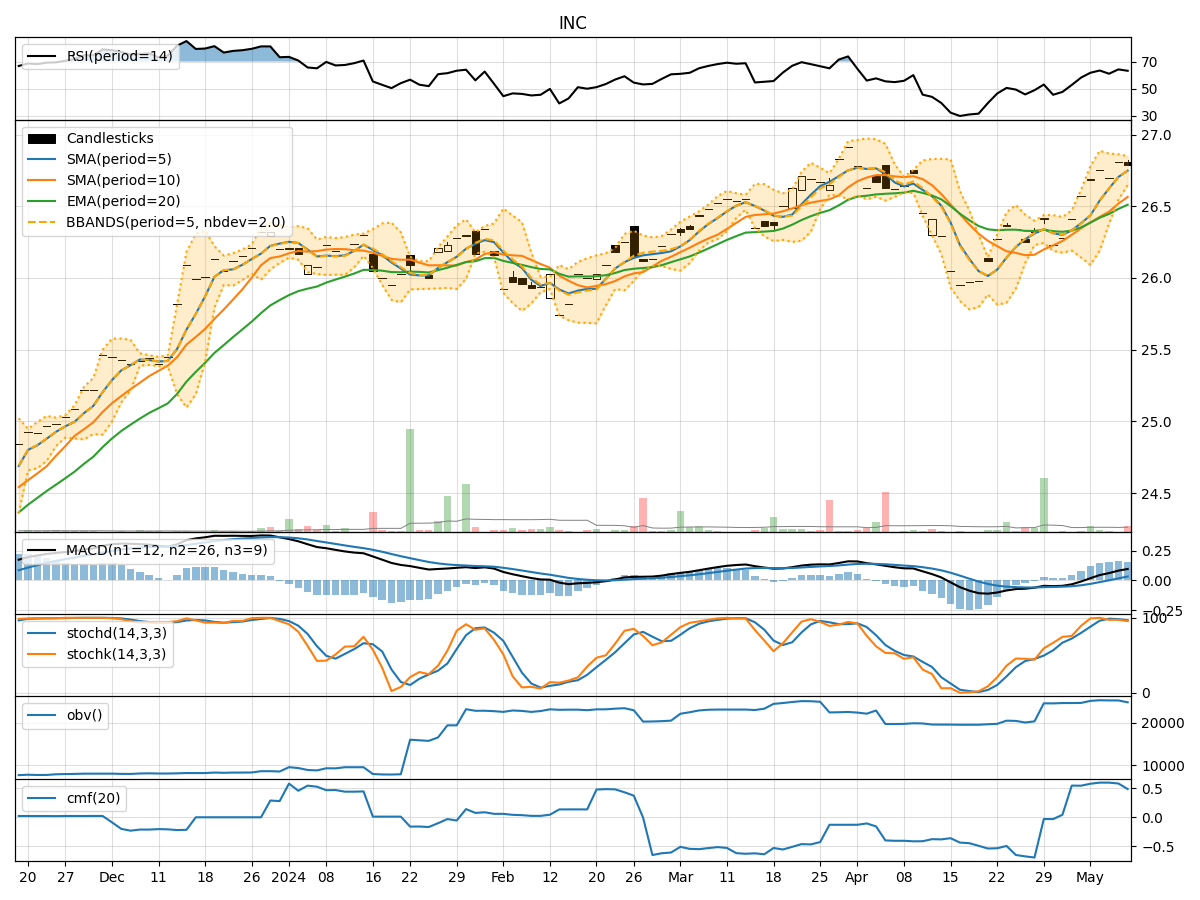
- Moving Averages (MA): The 5-day MA has been consistently above the closing prices, indicating a short-term uptrend.
- MACD: The MACD line has been trending upwards, with the MACD histogram showing positive values, suggesting bullish momentum.
- EMA: The EMA has been steadily increasing, supporting the bullish sentiment.
Momentum Indicators:
- RSI: The RSI has been in the neutral to slightly overbought territory, indicating moderate buying pressure.
- Stochastic Oscillator: Both %K and %D have been relatively high, signaling potential overbought conditions.
- Williams %R: The indicator has shown occasional oversold conditions but generally hovers around neutral levels.
Volatility Indicators:
- Bollinger Bands: The stock price has mostly stayed within the bands, suggesting a period of consolidation.
- Bollinger %B: The %B indicator has fluctuated within a narrow range, indicating stable volatility levels.
Volume Indicators:
- On-Balance Volume (OBV): The OBV has shown a slight increase, reflecting positive volume flow.
- Chaikin Money Flow (CMF): The CMF has been positive, indicating buying pressure in the market.
Key Observations:
- The trend indicators point towards a bullish bias, supported by the moving averages and MACD.
- Momentum indicators suggest a slightly overbought condition, which may lead to a short-term pullback.
- Volatility indicators indicate a period of consolidation with stable price movements.
- Volume indicators show a moderate increase in buying volume, supporting the bullish outlook.
Conclusion:
Based on the analysis of the technical indicators, the stock is likely to continue its upward trajectory in the short term. However, given the slightly overbought conditions indicated by the momentum indicators, we may see a temporary pullback or consolidation before the uptrend resumes. Traders should monitor key support levels and consider taking profits on any significant price spikes. Overall, the outlook remains bullish with a potential for further upside movement in the coming days.