Technical Analysis of IIGD 2024-05-10
Overview:
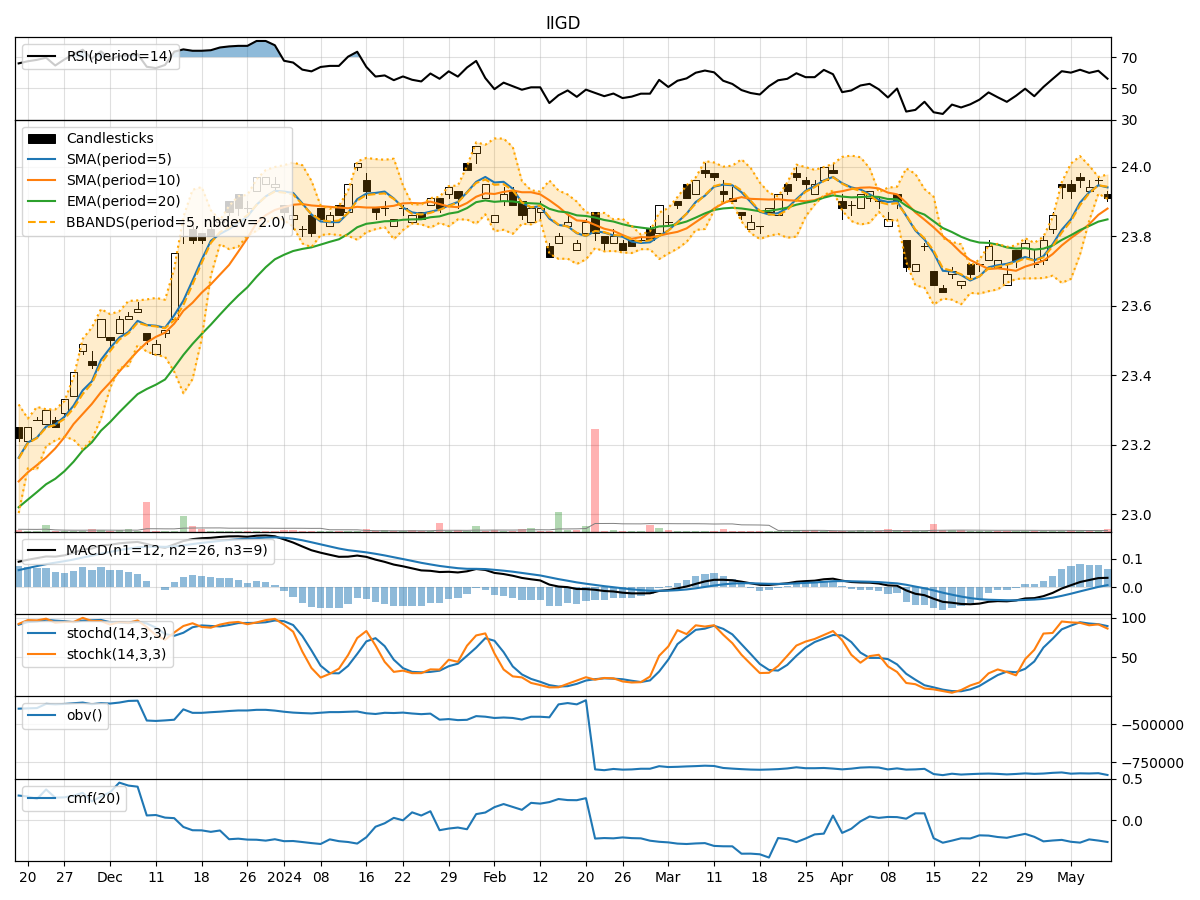
In analyzing the technical indicators for IIGD over the last 5 days, we will delve into the trend, momentum, volatility, and volume indicators to provide a comprehensive outlook on the possible stock price movement. By examining these key indicators, we aim to offer valuable insights and predictions for the upcoming days.
Trend Indicators:
- Moving Averages (MA): The 5-day MA has been consistently above the closing price, indicating a short-term uptrend.
- MACD: The MACD line has been above the signal line, suggesting bullish momentum.
- EMA: The exponential moving average has been trending upwards, supporting the bullish sentiment.
Key Observation: The trend indicators point towards an upward trend in the stock price.
Momentum Indicators:
- RSI: The Relative Strength Index has been fluctuating around the 60 level, indicating moderate momentum.
- Stochastic Oscillator: Both %K and %D have been in the overbought zone, suggesting potential for a pullback.
- Williams %R: The indicator has been in the oversold territory, signaling a possible reversal.
Key Observation: Momentum indicators suggest a mixed outlook with a slight bias towards a bearish reversal.
Volatility Indicators:
- Bollinger Bands: The bands have been relatively narrow, indicating low volatility.
- Bollinger %B: The %B indicator has been hovering around the midline, reflecting consolidation.
- Average True Range (ATR): ATR has been relatively stable, further confirming low volatility.
Key Observation: Volatility indicators signal a sideways movement with a lack of significant price fluctuations.
Volume Indicators:
- On-Balance Volume (OBV): The OBV has shown a slight decline, suggesting selling pressure.
- Chaikin Money Flow (CMF): CMF has been negative, indicating outflow of money from the stock.
Key Observation: Volume indicators imply a bearish sentiment with decreasing buying interest.
Conclusion:
Based on the analysis of trend, momentum, volatility, and volume indicators, the overall outlook for IIGD in the next few days is mixed with a slight bearish bias. While the trend indicators suggest an upward trajectory, momentum indicators hint at a potential bearish reversal. Volatility indicators point towards sideways movement, and volume indicators indicate a bearish sentiment.
Recommendation:
Considering the comprehensive analysis of technical indicators, it is advisable to exercise caution in trading IIGD in the upcoming days. Traders should closely monitor key levels and wait for confirmation of a clear trend before making significant trading decisions. Consolidation or a minor pullback may be expected in the short term.
Disclaimer:
This analysis is based solely on technical indicators and historical data, and actual market movements may vary. It is essential to consider other factors and conduct thorough research before making any investment decisions. Consulting with a financial advisor is recommended for personalized guidance tailored to individual investment goals and risk tolerance levels.