Technical Analysis of IGPT 2024-05-10
Overview:
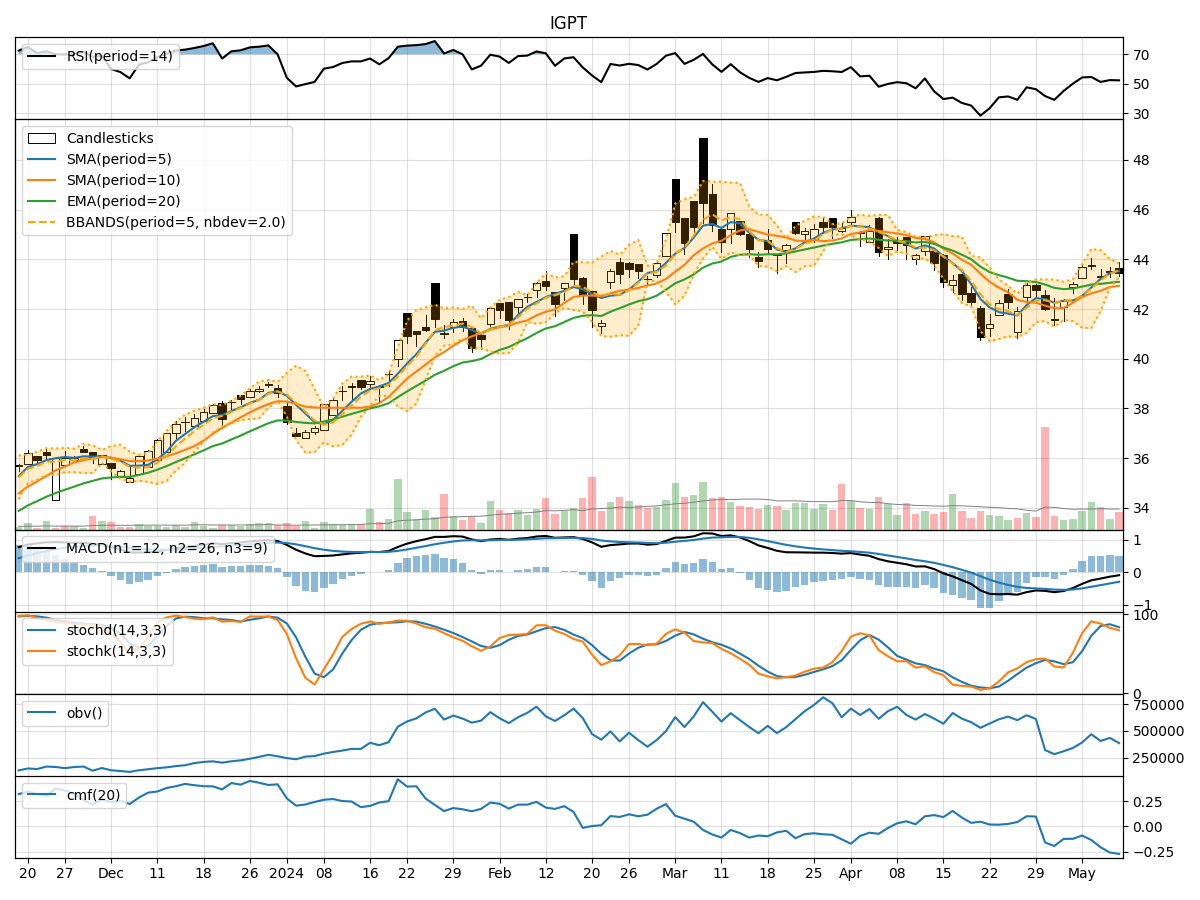
In analyzing the technical indicators for IGPT over the last 5 days, we will delve into the trend, momentum, volatility, and volume indicators to provide a comprehensive outlook on the possible stock price movement. By examining these key aspects, we aim to offer valuable insights and predictions for the upcoming days.
Trend Analysis:
- Moving Averages (MA): The 5-day Moving Average (MA) has been consistently above the Simple Moving Average (SMA) and Exponential Moving Average (EMA), indicating a bullish trend.
- MACD: The MACD line has been below the signal line but showing signs of convergence, suggesting a potential bullish crossover.
- Momentum: The momentum indicators are trending upwards, with the stock price consistently above the moving averages, reflecting positive momentum.
Momentum Analysis:
- RSI: The Relative Strength Index (RSI) is in the neutral zone, indicating neither overbought nor oversold conditions.
- Stochastic Oscillator: Both %K and %D are in the overbought territory, suggesting a potential reversal or consolidation.
- Williams %R: The Williams %R is also in the oversold region, signaling a possible reversal in the short term.
Volatility Analysis:
- Bollinger Bands: The stock price has been trading within the Bollinger Bands, with the bands narrowing, indicating reduced volatility.
- Bollinger %B: The %B indicator is below 1, suggesting the stock is trading below the upper Bollinger Band, potentially indicating a buying opportunity.
Volume Analysis:
- On-Balance Volume (OBV): The OBV has been fluctuating, indicating mixed buying and selling pressure.
- Chaikin Money Flow (CMF): The CMF is negative, suggesting a net outflow of money from the stock.
Conclusion:
Based on the analysis of the technical indicators, the stock of IGPT is showing bullish signals in terms of trend and momentum. However, the overbought conditions in the Stochastic Oscillator and Williams %R, along with the negative CMF, indicate a potential short-term consolidation or pullback. Traders should monitor the price action closely for a possible entry point during the consolidation phase.
In the next few days, we anticipate the stock price of IGPT to experience a sideways movement or a minor correction before potentially resuming its upward trajectory. Investors should consider waiting for a clearer signal before making significant trading decisions.