Technical Analysis of IDEV 2024-05-31
Overview:
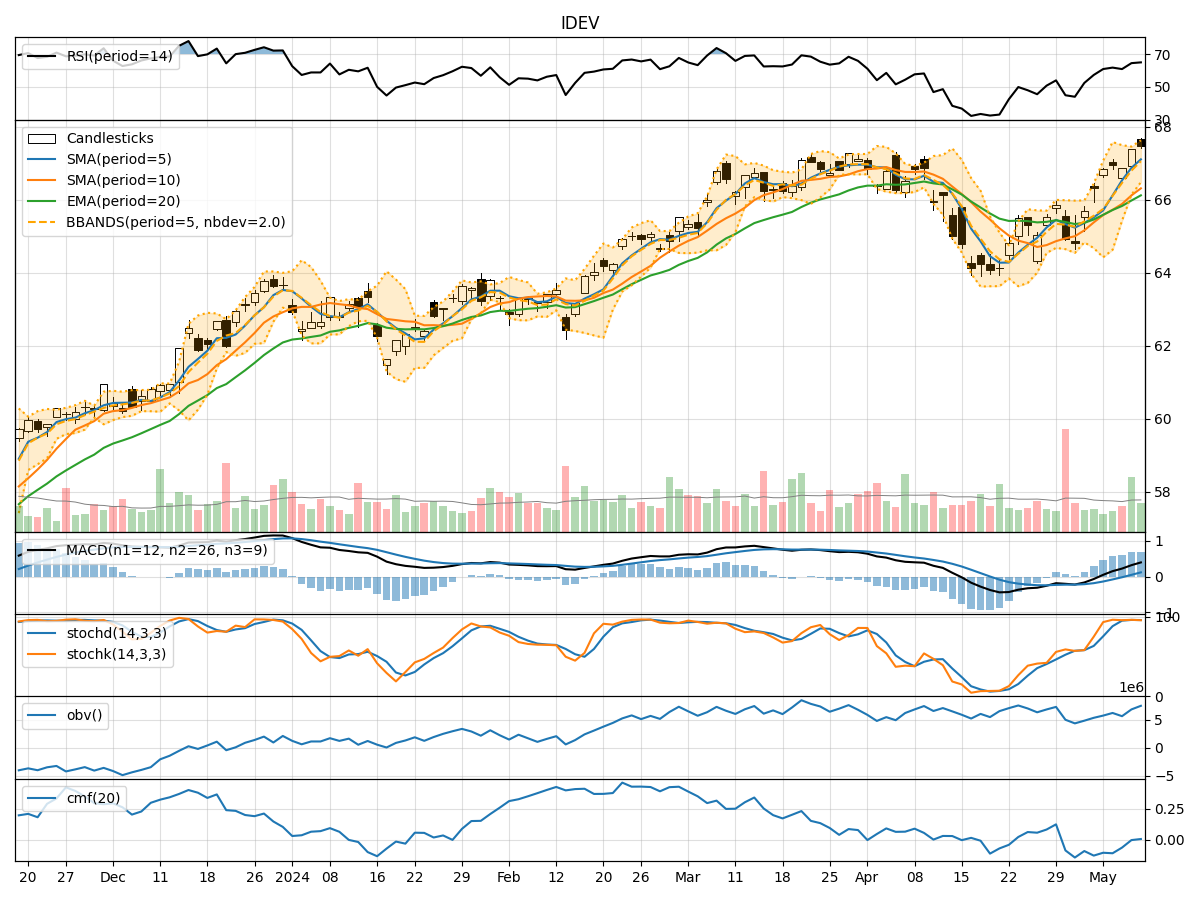
In analyzing the technical indicators for IDEV over the last 5 days, we will delve into the trend, momentum, volatility, and volume indicators to provide a comprehensive outlook on the possible stock price movement in the coming days. By examining these key aspects, we aim to offer valuable insights and predictions for potential investors.
Trend Indicators:
- Moving Averages (MA): The 5-day moving average has been fluctuating around the closing prices, indicating a lack of clear trend direction.
- MACD: The MACD line has been hovering around the signal line, suggesting a neutral stance in terms of momentum.
- EMA: The exponential moving average has shown slight fluctuations but has not provided a strong indication of a clear trend.
Key Observation: The trend indicators do not show a definitive trend direction, signaling a period of consolidation or sideways movement.
Momentum Indicators:
- RSI: The Relative Strength Index has been fluctuating around the mid-level, indicating a balanced momentum between buying and selling pressure.
- Stochastic Oscillator: Both %K and %D have been in the oversold region, suggesting a potential reversal in momentum.
- Williams %R: The indicator has shown oversold conditions, hinting at a possible buying opportunity.
Key Observation: Momentum indicators suggest a potential reversal in the current trend, with a slight bias towards a bullish momentum.
Volatility Indicators:
- Bollinger Bands: The bands have been relatively narrow, indicating low volatility in the stock price.
- Bollinger %B: The %B indicator has been close to 0.5, reflecting a balanced state between upper and lower bands.
Key Observation: Volatility indicators point towards a period of low volatility and potential price consolidation.
Volume Indicators:
- On-Balance Volume (OBV): The OBV has shown mixed signals, with fluctuations in volume accumulation.
- Chaikin Money Flow (CMF): The CMF has been positive, indicating buying pressure in the market.
Key Observation: Volume indicators suggest a mixed sentiment, with some buying interest reflected in the CMF.
Conclusion:
Based on the analysis of the technical indicators, the stock price of IDEV is likely to experience sideways movement in the next few days. The lack of a clear trend direction, coupled with low volatility and mixed volume signals, indicates a period of consolidation. However, the momentum indicators slightly favor a bullish bias, suggesting a potential uptick in the stock price.
Recommendation: Investors should closely monitor the price action for any signs of a breakout or trend reversal. Consider setting tight stop-loss levels to manage risk effectively in a sideways market environment.