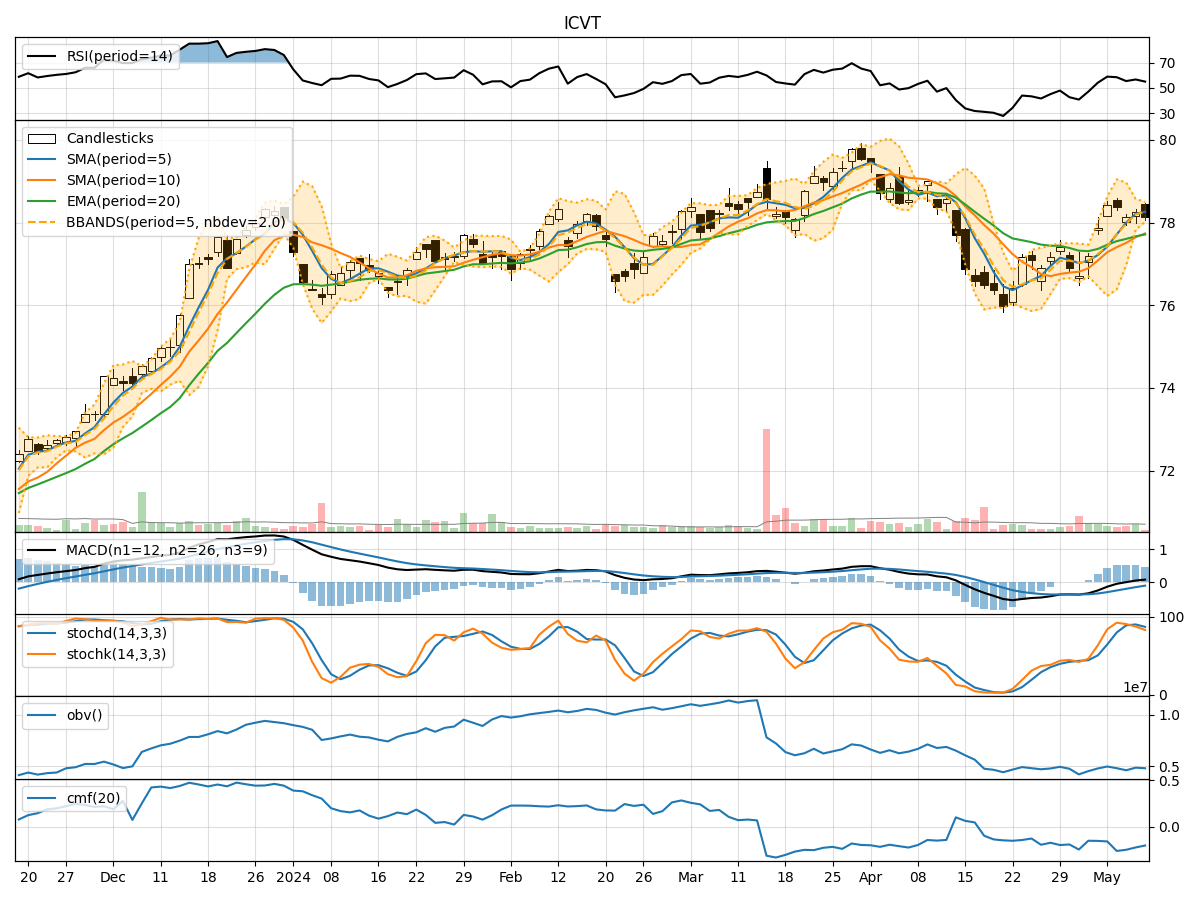
Technical Analysis of ICVT 2024-05-10
Overview:
In analyzing the technical indicators for ICVT over the last 5 days, we will delve into the trend, momentum, volatility, and volume indicators to provide a comprehensive outlook on the possible stock price movement in the coming days.
Trend Analysis:
- Moving Averages (MA): The 5-day Moving Average (MA) has been consistently above the Simple Moving Average (SMA) and Exponential Moving Average (EMA), indicating a short-term bullish trend.
- MACD: The MACD line has been consistently above the signal line, suggesting bullish momentum in the stock price.
- MACD Histogram: The MACD Histogram has been gradually increasing, indicating strengthening bullish momentum.
Momentum Analysis:
- RSI: The Relative Strength Index (RSI) has been fluctuating around the 50 level, indicating a neutral momentum in the stock.
- Stochastic Oscillator: The Stochastic Oscillator shows the stock is not in overbought or oversold territory, suggesting a balanced momentum.
- Williams %R: The Williams %R is hovering around -20, indicating a potential overbought condition.
Volatility Analysis:
- Bollinger Bands: The Bollinger Bands are narrowing, suggesting decreasing volatility in the stock price.
- Bollinger %B: The %B indicator is below 0.5, indicating the stock price is trading closer to the lower band.
Volume Analysis:
- On-Balance Volume (OBV): The OBV has been fluctuating, indicating mixed buying and selling pressure.
- Chaikin Money Flow (CMF): The CMF is negative, suggesting a lack of strong buying pressure in the stock.
Conclusion:
Based on the analysis of the technical indicators, the stock of ICVT is likely to experience sideways movement in the next few days. The trend indicators suggest a short-term bullish bias, supported by the MACD and moving averages. However, the momentum indicators show a neutral stance with no clear direction. The volatility is decreasing, indicating a potential consolidation phase, while the volume indicators reflect mixed sentiment with no strong buying pressure.
Therefore, it is recommended to exercise caution and closely monitor the stock price for any potential breakout or reversal signals before making any trading decisions.