Technical Analysis of IBTI 2024-05-10
Overview:
In analyzing the technical indicators for IBTI over the last 5 days, we will delve into the trend, momentum, volatility, and volume indicators to provide a comprehensive outlook on the possible stock price movement in the coming days. By examining these key indicators, we aim to offer valuable insights and predictions to guide your investment decisions.
Trend Analysis:
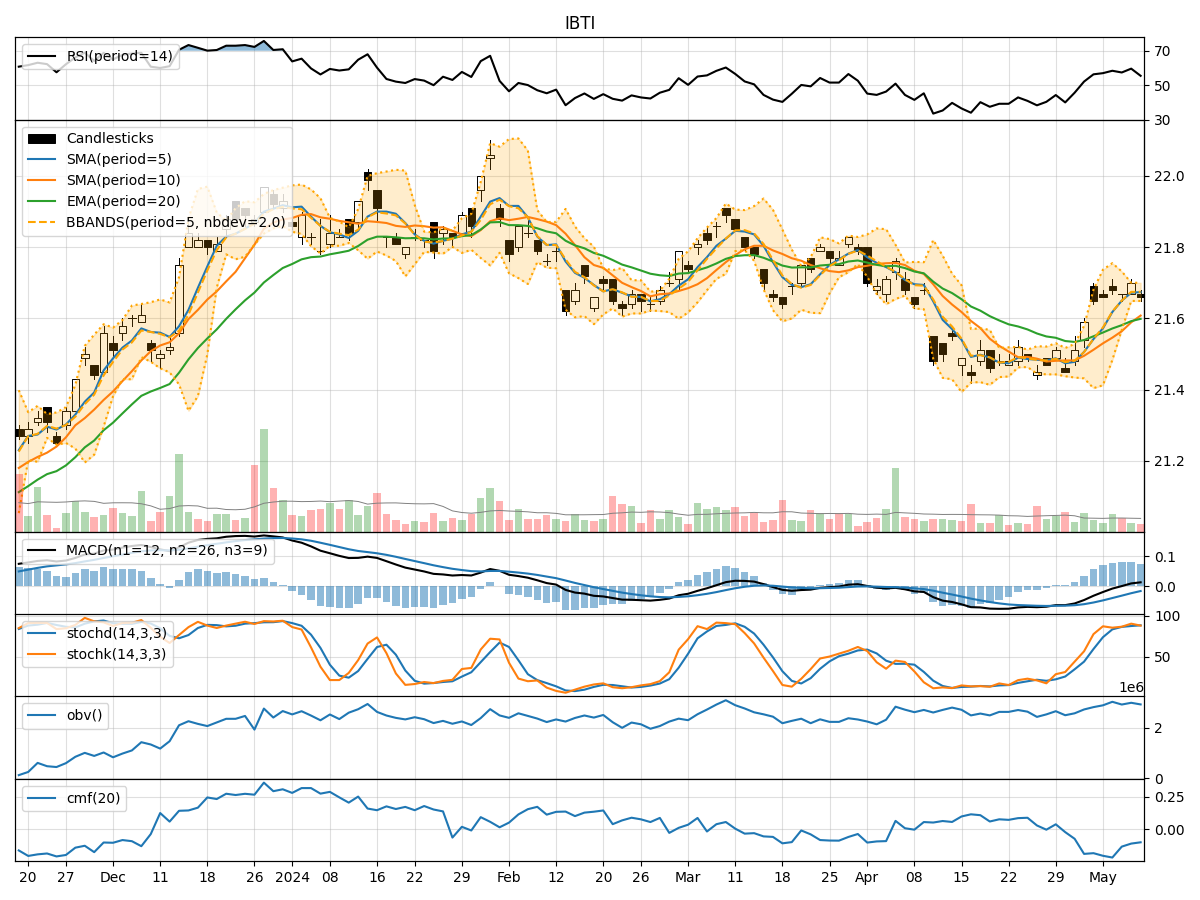
- Moving Averages (MA): The 5-day Moving Average (MA) has been relatively stable around the current stock price, indicating a neutral trend.
- MACD: The Moving Average Convergence Divergence (MACD) has shown a slight positive trend, with the MACD line consistently above the signal line.
- EMA: The Exponential Moving Average (EMA) has been gradually increasing, suggesting a potential bullish momentum.
Key Observation: The trend indicators point towards a slightly bullish sentiment in the short term.
Momentum Analysis:
- RSI: The Relative Strength Index (RSI) has been fluctuating around the neutral zone, indicating indecision in the market.
- Stochastic Oscillator: Both %K and %D lines of the Stochastic Oscillator have been hovering in the overbought territory, signaling a potential reversal.
- Williams %R: The Williams %R is in the oversold region, suggesting a possible buying opportunity.
Key Observation: Momentum indicators are mixed, with a slight bias towards a bearish reversal.
Volatility Analysis:
- Bollinger Bands: The Bollinger Bands have been narrowing, indicating decreasing volatility in the stock price.
- Bollinger %B: The %B indicator is close to the lower band, suggesting a potential oversold condition.
- Average True Range (ATR): The ATR has been decreasing, reflecting reduced price volatility.
Key Observation: Volatility indicators signal a period of consolidation and potential price stabilization.
Volume Analysis:
- On-Balance Volume (OBV): The OBV has shown a slight decline, indicating selling pressure in the stock.
- Chaikin Money Flow (CMF): The CMF has been negative, suggesting outflow of money from the stock.
Key Observation: Volume indicators point towards a bearish sentiment with decreasing buying interest.
Conclusion:
Based on the analysis of trend, momentum, volatility, and volume indicators, the overall outlook for IBTI in the next few days is bearish. The trend indicators suggest a potential bullish momentum, while momentum indicators show a mixed sentiment with a bearish bias. Volatility indicators indicate a period of consolidation, and volume indicators signal a bearish sentiment with decreasing buying interest.
Key Conclusion: The stock is likely to experience a downward movement in the coming days, with a possibility of further price decline. Traders should exercise caution and consider implementing risk management strategies to navigate potential downside risks.