Technical Analysis of IBND 2024-05-10
Overview:
In analyzing the technical indicators for IBND over the last 5 days, we will delve into the trend, momentum, volatility, and volume indicators to provide a comprehensive outlook on the possible stock price movement. By examining these key aspects, we aim to offer valuable insights and predictions for the upcoming days.
Trend Analysis:
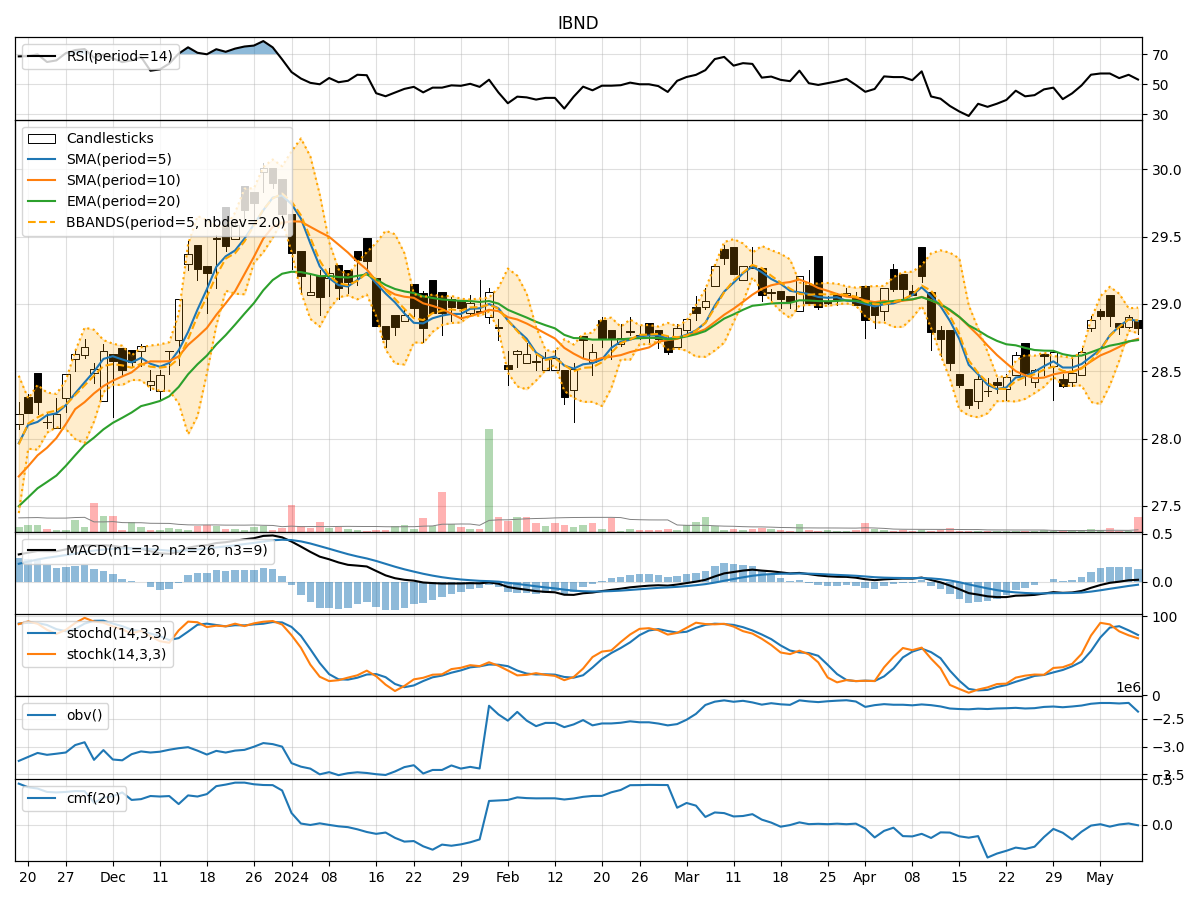
- Moving Averages (MA): The 5-day Moving Average (MA) has been relatively stable, hovering around the current price levels. This indicates a short-term trend that is neither strongly bullish nor bearish.
- MACD and Signal Line: The MACD line has been consistently positive, suggesting a bullish momentum in the stock. The MACD Histogram has also been trending upwards, indicating strengthening bullish momentum.
- Conclusion: The trend indicators point towards a bullish sentiment in the short term.
Momentum Analysis:
- Relative Strength Index (RSI): The RSI has been fluctuating around the mid-level, indicating a balanced momentum between buying and selling pressure.
- Stochastic Oscillator: Both %K and %D levels have been declining, suggesting a potential shift towards oversold conditions.
- Williams %R: The Williams %R is in the oversold territory, indicating a possible buying opportunity.
- Conclusion: The momentum indicators signal a neutral to slightly bearish momentum in the near future.
Volatility Analysis:
- Bollinger Bands (BB): The stock price has been trading within the Bollinger Bands, with the bands narrowing in recent days. This suggests decreasing volatility and a potential period of consolidation.
- Conclusion: The volatility indicators imply a consolidation phase with reduced price fluctuations.
Volume Analysis:
- On-Balance Volume (OBV): The OBV has shown mixed movements, indicating indecision among market participants.
- Chaikin Money Flow (CMF): The CMF has been fluctuating around the zero line, reflecting a lack of strong buying or selling pressure.
- Conclusion: The volume indicators suggest a sideways movement with no clear direction in terms of volume-based trends.
Overall Conclusion:
Based on the analysis of trend, momentum, volatility, and volume indicators, the next few days for IBND are likely to see a sideways consolidation with a slight bearish bias in momentum. While the trend indicators point towards a bullish sentiment, the momentum and volume indicators suggest a more cautious outlook.
Key Takeaways: - Trend: Upward - Momentum: Slightly Bearish - Volatility: Consolidation - Volume: Sideways
Recommendation: It is advisable to closely monitor the price action and key support/resistance levels for potential entry or exit points. Consider implementing risk management strategies to navigate the current market conditions effectively.