Technical Analysis of IBIJ 2024-05-10
Overview:
In analyzing the technical indicators for IBIJ stock over the last 5 days, we will delve into the trends, momentum, volatility, and volume indicators to provide a comprehensive outlook on the possible stock price movement in the coming days. By examining these key factors, we aim to offer valuable insights and recommendations for potential investors.
Trend Indicators:
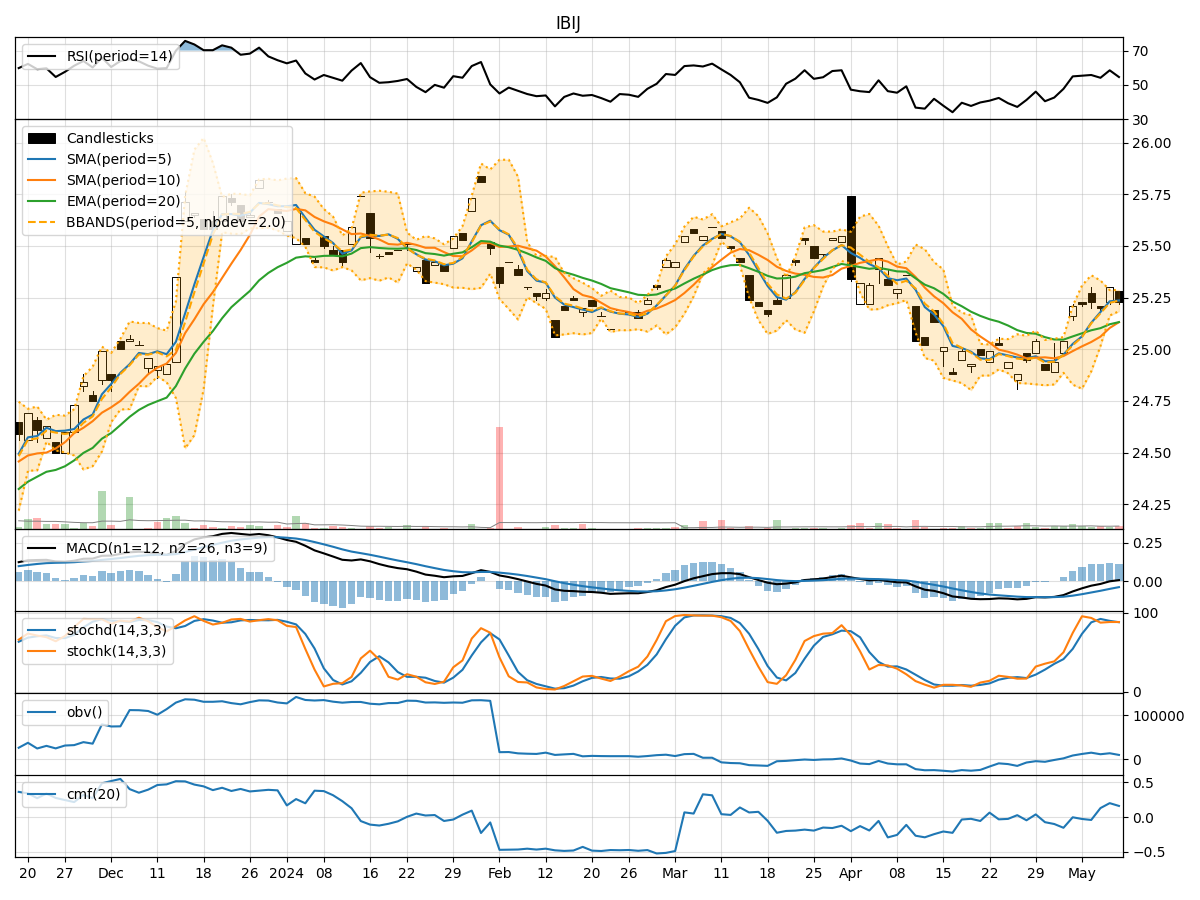
- Moving Averages (MA): The 5-day Moving Average (MA) has been consistently above the Simple Moving Average (SMA) and Exponential Moving Average (EMA), indicating a short-term bullish trend.
- MACD: The Moving Average Convergence Divergence (MACD) has shown positive values, with the MACD line consistently above the signal line, suggesting bullish momentum.
- MACD Histogram: The MACD Histogram has been increasing, indicating strengthening bullish momentum.
Momentum Indicators:
- RSI: The Relative Strength Index (RSI) has been fluctuating around the 50 level, indicating a neutral momentum in the stock.
- Stochastic Oscillator: The Stochastic Oscillator has shown mixed signals, with the %K line crossing the %D line multiple times, suggesting indecision in the market.
- Williams %R: The Williams %R is hovering around oversold levels, indicating a potential reversal in the stock price.
Volatility Indicators:
- Bollinger Bands: The Bollinger Bands have shown a narrowing of the bands, indicating decreasing volatility in the stock.
- Bollinger %B: The %B indicator is below 1, suggesting the stock is trading below the upper Bollinger Band, potentially indicating a buying opportunity.
Volume Indicators:
- On-Balance Volume (OBV): The OBV has shown mixed signals, with fluctuations in volume accumulation, indicating uncertainty among investors.
- Chaikin Money Flow (CMF): The CMF has been positive, indicating buying pressure in the stock.
Key Observations:
- The trend indicators suggest a bullish sentiment in the short term.
- Momentum indicators show mixed signals, indicating indecision among traders.
- Volatility indicators point towards decreasing volatility in the stock.
- Volume indicators reflect uncertainty but with a slight buying pressure.
Conclusion:
Based on the analysis of the technical indicators, the stock of IBIJ is likely to experience sideways consolidation in the coming days. The bullish trend indicated by moving averages and MACD may be hindered by the neutral momentum and mixed signals from the stochastic oscillator. The decreasing volatility and uncertain volume accumulation further support the view of sideways movement. Investors should exercise caution and wait for clearer signals before making significant trading decisions.