Technical Analysis of IBDS 2024-05-10
Overview:
In analyzing the provided technical indicators for the last 5 days, we will delve into the trend, momentum, volatility, and volume indicators to forecast the possible stock price movement for the next few days. By examining these key aspects, we aim to provide a comprehensive and insightful prediction backed by data-driven analysis.
Trend Analysis:
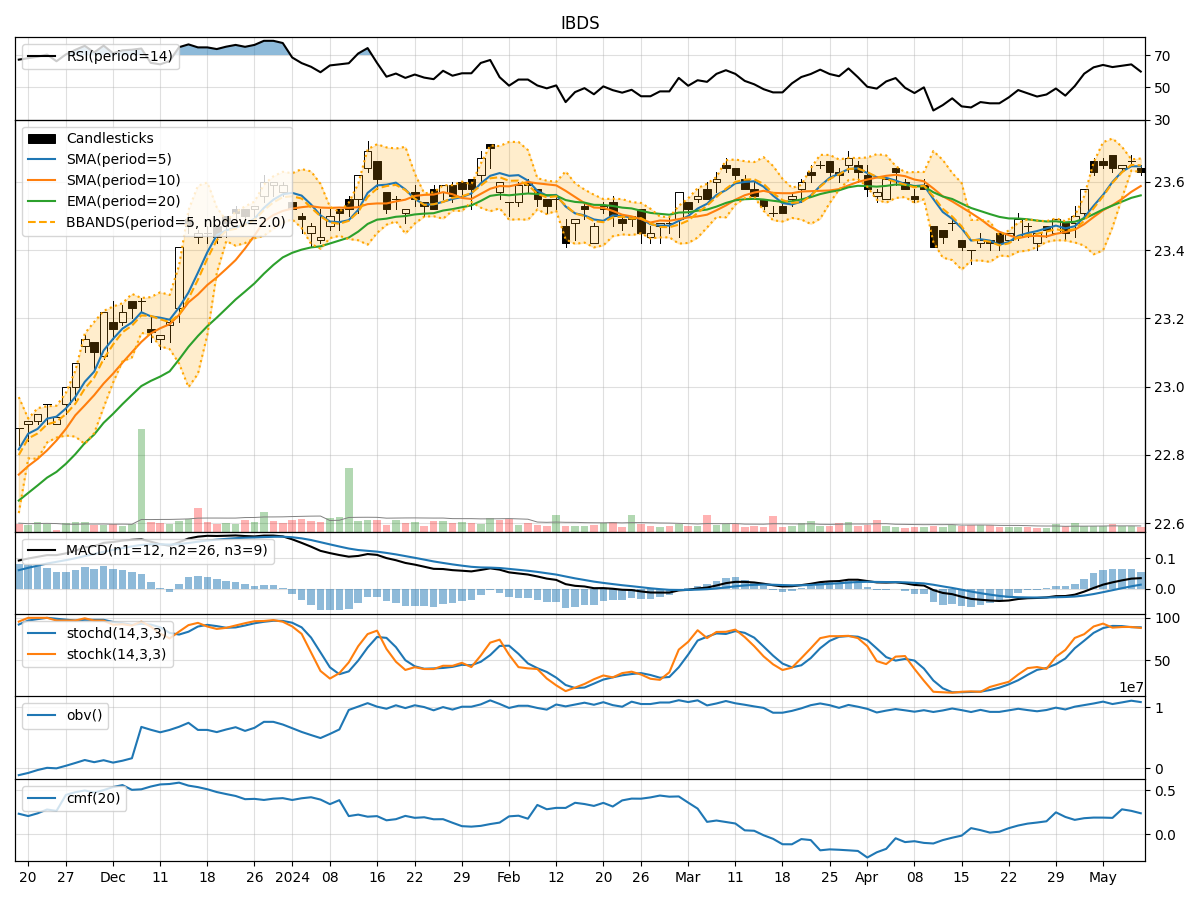
- Moving Averages (MA): The 5-day Moving Average (MA) has been consistently above the Simple Moving Average (SMA) and Exponential Moving Average (EMA), indicating a bullish trend.
- MACD: The MACD line has been consistently above the signal line, with both lines showing an upward trend, suggesting bullish momentum in the stock price.
Momentum Analysis:
- RSI: The Relative Strength Index (RSI) has been fluctuating around the 60-70 range, indicating neutral momentum without being overbought or oversold.
- Stochastic Oscillator: Both %K and %D lines of the Stochastic Oscillator have been hovering around 80, suggesting the stock is neither overbought nor oversold.
Volatility Analysis:
- Bollinger Bands (BB): The stock price has been trading within the Bollinger Bands, with the bands narrowing, indicating lower volatility in the near term.
Volume Analysis:
- On-Balance Volume (OBV): The OBV has shown mixed movements, indicating indecisiveness in terms of volume flow.
- Chaikin Money Flow (CMF): The CMF has been positive but fluctuating, suggesting mixed sentiment regarding the stock.
Key Observations:
- The trend indicators suggest a bullish bias in the stock price.
- Momentum indicators point towards neutral momentum without extreme overbought or oversold conditions.
- Volatility indicators indicate lower volatility in the near future.
- Volume indicators show indecisiveness in volume flow and sentiment.
Conclusion:
Based on the analysis of the technical indicators, the next few days' possible stock price movement is likely to be upward with a bullish bias. The stock is expected to continue its upward trend, supported by the positive MACD and moving averages. However, the momentum indicators suggest a more neutral stance, indicating potential consolidation or minor pullbacks before resuming the upward trajectory. Traders and investors should monitor the price action closely for any signs of reversal or continuation patterns to make informed decisions.