Technical Analysis of IBDP 2024-05-10
Overview:
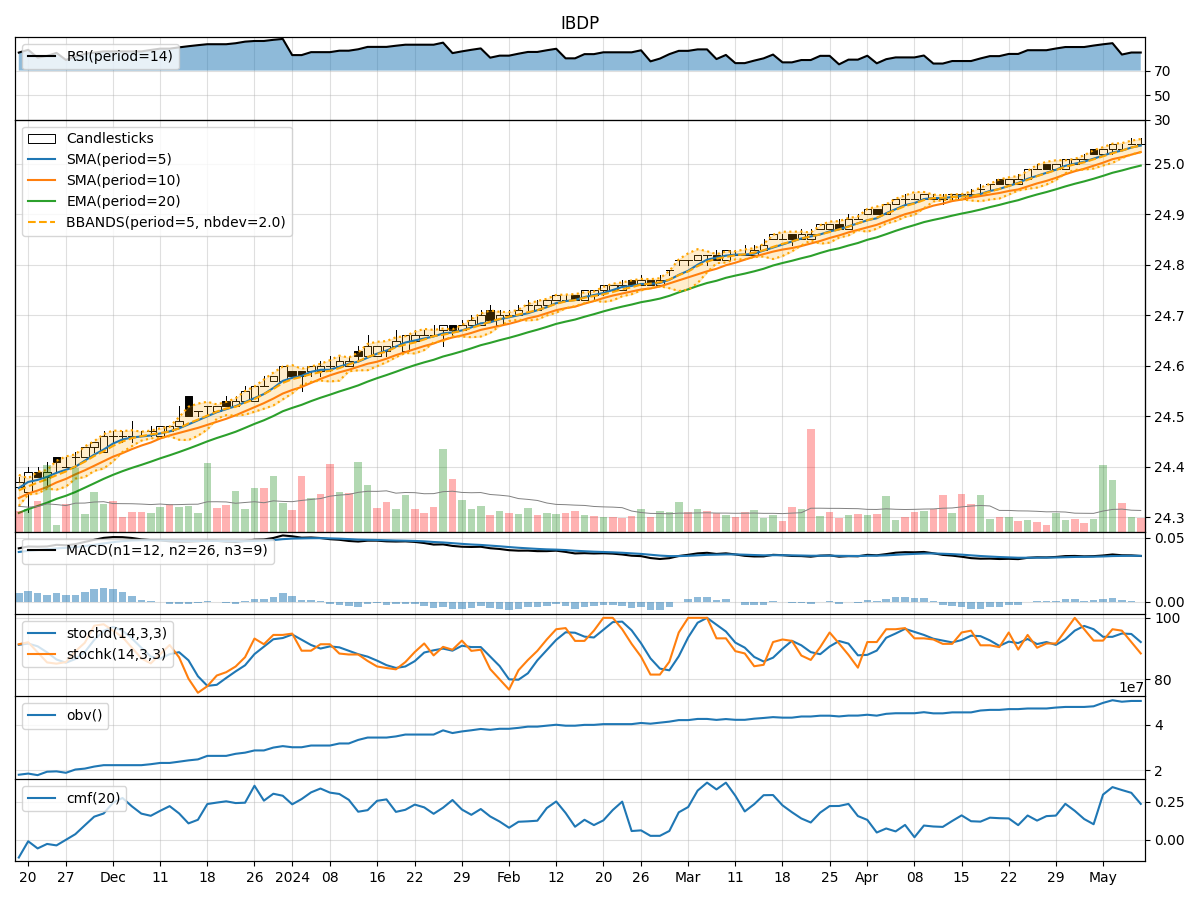
In the last 5 trading days, the stock has shown relatively stable price movements with minor fluctuations. The trend indicators suggest a consistent uptrend, supported by positive MACD values and increasing moving averages. Momentum indicators indicate overbought conditions, while volatility remains relatively low. Volume indicators show a positive trend in On-Balance Volume (OBV) and Chaikin Money Flow (CMF).
Trend Indicators:
- Moving averages (MA) are trending upwards, indicating a bullish sentiment.
- MACD values are positive, suggesting a continuation of the current uptrend.
- EMA values are also increasing, supporting the bullish outlook.
Momentum Indicators:
- RSI values are high, indicating overbought conditions.
- Stochastic indicators show a slight decline, suggesting a potential reversal.
- Williams %R is negative, indicating a bearish sentiment.
Volatility Indicators:
- Bollinger Bands are relatively narrow, indicating low volatility.
- Bands are not expanding significantly, suggesting a lack of strong price movements.
Volume Indicators:
- OBV is increasing, indicating accumulation by investors.
- CMF is positive, reflecting buying pressure in the market.
Key Observations:
- Trend: The stock is in a clear uptrend based on moving averages and MACD values.
- Momentum: Overbought conditions suggest a potential reversal or consolidation.
- Volatility: Low volatility indicates a sideways or consolidation phase.
- Volume: Positive OBV and CMF values indicate bullish sentiment among investors.
Conclusion:
Based on the technical indicators and analysis: - The stock is likely to continue its uptrend in the short term. - However, the overbought conditions suggest a potential pullback or consolidation phase. - Investors should monitor the stock closely for any signs of a reversal in momentum. - Overall, the outlook remains bullish but with caution due to the possibility of a short-term correction.
Recommendation:
- Consider taking profits if holding a long position due to overbought conditions.
- Wait for a pullback or consolidation before considering new long positions.
- Keep a close eye on momentum indicators for signs of a reversal in the trend.
Disclaimer:
Remember that technical analysis is not foolproof and should be used in conjunction with other forms of analysis. Market conditions can change rapidly, so it's essential to stay informed and adapt your strategy accordingly.