Technical Analysis of IAUF 2024-05-10
Overview:
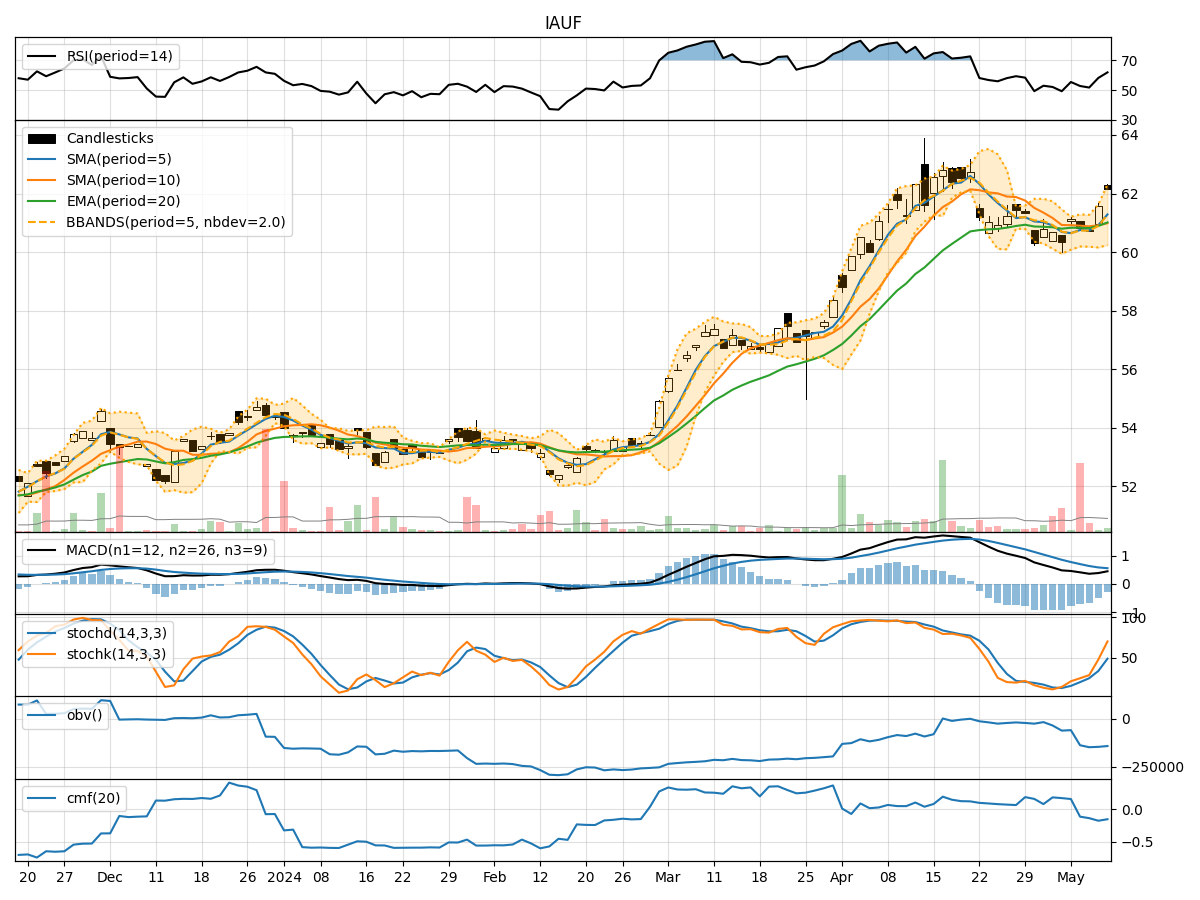
In the last 5 trading days, IAUF stock has shown mixed signals across various technical indicators. The trend indicators suggest a slightly positive momentum, with the Moving Average Convergence Divergence (MACD) showing a potential bullish crossover. However, the momentum indicators indicate a neutral to slightly bearish sentiment, with the Relative Strength Index (RSI) hovering around the mid-level. Volatility indicators show a narrowing of the Bollinger Bands, indicating a potential decrease in volatility. Volume indicators suggest a slight decrease in On-Balance Volume (OBV) and Chaikin Money Flow (CMF), signaling a possible weakening of buying pressure.
Trend Indicators:
- Moving Averages (MA): The 5-day Moving Average (MA) is slightly above the Simple Moving Average (SMA) and Exponential Moving Average (EMA), indicating a short-term positive trend.
- MACD: The MACD line is approaching a bullish crossover with the signal line, suggesting a potential uptrend.
- MACD Histogram: The MACD Histogram is gradually moving towards the zero line, indicating a possible shift towards bullish momentum.
Momentum Indicators:
- RSI: The RSI is around 50, indicating a neutral sentiment with no clear overbought or oversold conditions.
- Stochastic Oscillator: The Stochastic Oscillator shows a recent uptrend but is approaching overbought territory, suggesting a potential reversal.
- Williams %R: The Williams %R is close to oversold levels, indicating a possible buying opportunity.
Volatility Indicators:
- Bollinger Bands (BB): The Bollinger Bands are narrowing, suggesting a decrease in price volatility and a potential period of consolidation.
- Bollinger %B: The %B indicator is below 1, indicating that the stock price is trading below the lower Bollinger Band, potentially signaling an oversold condition.
Volume Indicators:
- On-Balance Volume (OBV): The OBV has shown a slight decrease over the last few days, indicating a potential decrease in buying pressure.
- Chaikin Money Flow (CMF): The CMF is negative, suggesting a lack of buying interest in the stock.
Conclusion:
Based on the analysis of the technical indicators, the next few days for IAUF stock could see sideways movement or consolidation. While the trend indicators show a potential bullish bias, the momentum indicators suggest a neutral to slightly bearish sentiment. The narrowing Bollinger Bands and decreasing OBV and CMF indicate a lack of strong buying pressure. Therefore, it is advisable to exercise caution and closely monitor the price action for any potential breakout or reversal signals before making any trading decisions.