Technical Analysis of IAT 2024-05-10
Overview:
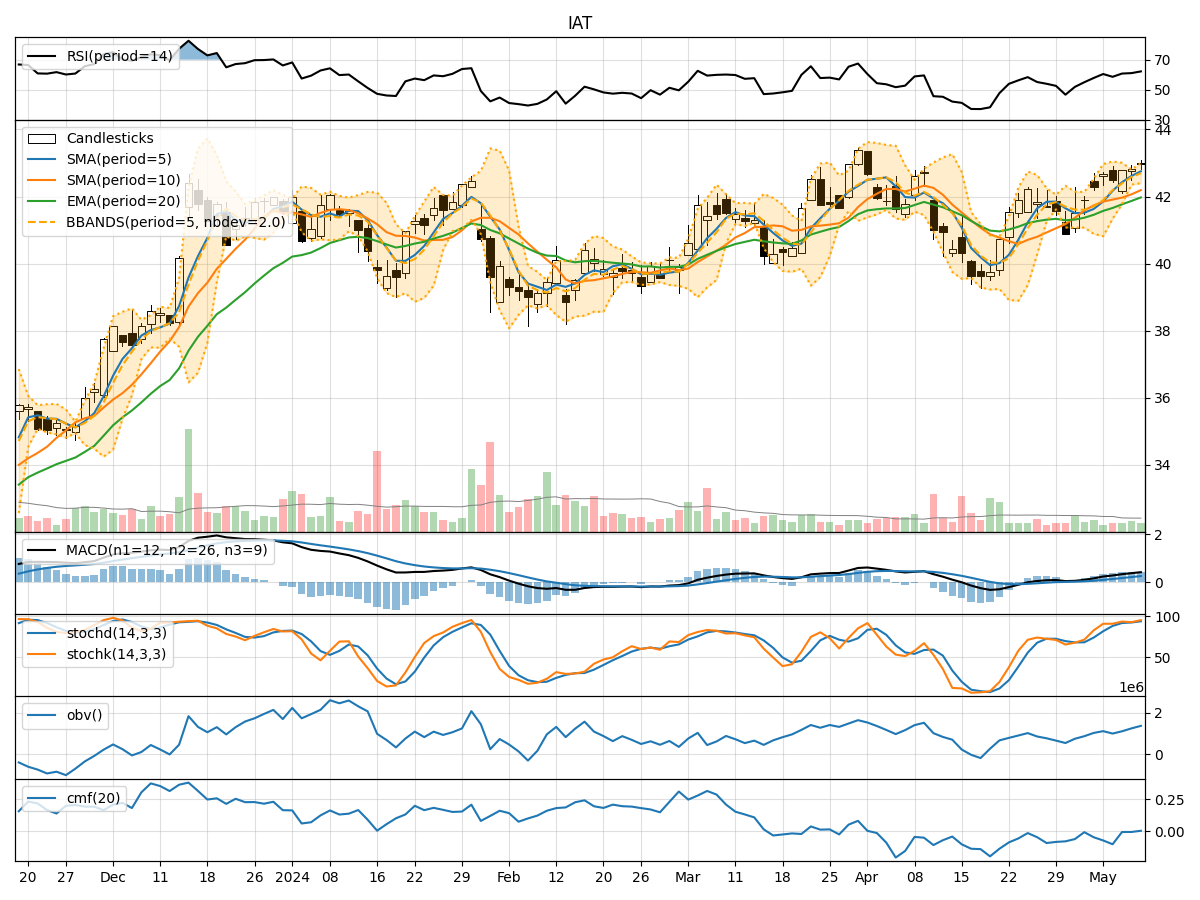
In the last 5 trading days, the stock price of IAT has shown a slight upward trend, with increasing closing prices and relatively stable volume levels. The trend indicators suggest a positive momentum, supported by the moving averages and MACD values. Momentum indicators like RSI and Stochastic oscillators indicate a slightly overbought condition but still within reasonable levels. Volatility indicators show a narrowing Bollinger Bands, indicating potential price consolidation. Volume indicators reflect mixed sentiment with a slightly positive CMF value.
Trend Indicators Analysis:
- Moving Averages (MA): The 5-day MA has been consistently above the 10-day SMA, indicating a short-term bullish trend.
- MACD: The MACD line has been consistently above the signal line, showing positive momentum.
- EMA: The EMA values have been increasing, supporting the bullish trend.
Momentum Indicators Analysis:
- RSI: The RSI values have been in the neutral to slightly overbought territory, suggesting a cautious view.
- Stochastic Oscillators: Both %K and %D values are in the overbought zone, indicating a potential reversal.
- Williams %R: The Williams %R is in the oversold region, signaling a possible pullback.
Volatility Indicators Analysis:
- Bollinger Bands: The narrowing of the Bollinger Bands suggests decreasing volatility and a potential period of consolidation.
- Bollinger %B: The %B value is close to 1, indicating the price is near the upper band.
Volume Indicators Analysis:
- On-Balance Volume (OBV): The OBV has shown a slight increase, reflecting some accumulation.
- Chaikin Money Flow (CMF): The CMF value is slightly positive, indicating some buying pressure.
Key Observations:
- The stock is currently in a short-term bullish trend based on moving averages and MACD.
- Momentum indicators suggest a cautious view due to overbought conditions.
- Volatility is decreasing, indicating a potential period of consolidation.
- Volume indicators show mixed sentiment with a slight positive bias.
Conclusion:
Based on the analysis of technical indicators, the next few days' possible stock price movement for IAT is likely to experience a period of consolidation. The bullish trend may pause or experience a slight pullback due to overbought conditions in momentum indicators. The narrowing Bollinger Bands and mixed volume signals support the view of a sideways movement. Traders should be cautious and consider potential profit-taking opportunities or wait for clearer signals before entering new positions.