Technical Analysis of HYZD 2024-05-10
Overview:
In analyzing the technical indicators for HYZD over the last 5 days, we will delve into the trend, momentum, volatility, and volume indicators to provide a comprehensive outlook on the possible stock price movement. By examining these key aspects, we aim to offer valuable insights and predictions for the upcoming days.
Trend Analysis:
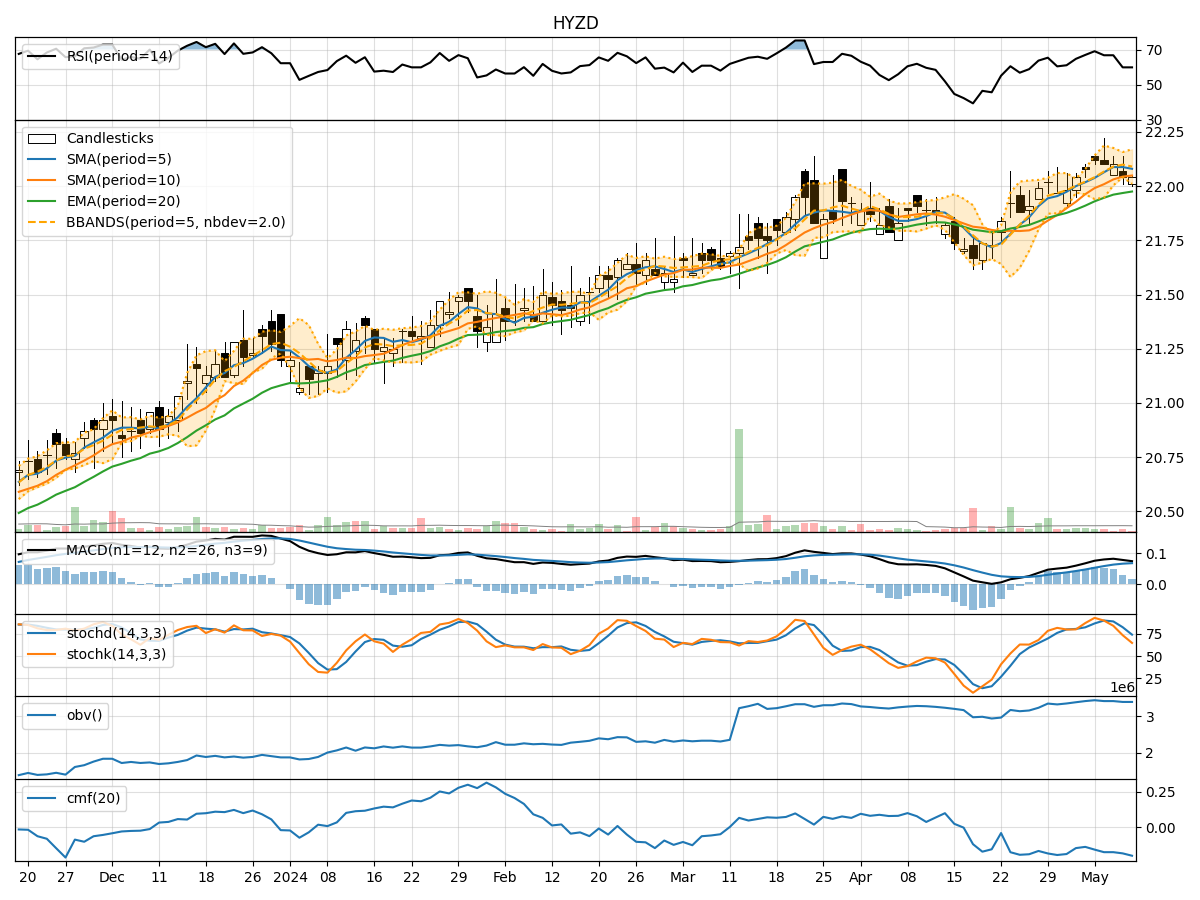
- Moving Averages (MA): The 5-day Moving Average (MA) has been relatively stable around the closing prices, indicating a consistent trend.
- MACD: The Moving Average Convergence Divergence (MACD) has shown a slight positive trend, with the MACD line consistently above the signal line.
- RSI: The Relative Strength Index (RSI) has fluctuated but generally stayed within the neutral to overbought range, suggesting a balanced momentum.
Key Observation: The trend indicators suggest a neutral to slightly bullish outlook for HYZD.
Momentum Analysis:
- Stochastic Oscillator: The Stochastic Oscillator has been gradually decreasing, indicating a potential slowdown in momentum.
- Williams %R: The Williams %R has been in the oversold territory, signaling a possible reversal in the short term.
Key Observation: The momentum indicators point towards a potential bearish reversal in the near future.
Volatility Analysis:
- Bollinger Bands: The Bollinger Bands have shown narrowing volatility, with the bands converging towards the moving average.
- Volatility Bands: The volatility bands have tightened, suggesting a period of consolidation or reduced price movement.
Key Observation: The volatility indicators imply a consolidation phase for HYZD.
Volume Analysis:
- On-Balance Volume (OBV): The OBV has remained relatively stable, indicating a balance between buying and selling pressure.
- Chaikin Money Flow (CMF): The CMF has been negative, reflecting a slight outflow of money from the stock.
Key Observation: The volume indicators suggest a neutral sentiment in terms of buying and selling pressure.
Conclusion:
Based on the analysis of the trend, momentum, volatility, and volume indicators, the overall outlook for HYZD in the next few days is as follows: - Trend: Neutral to slightly bullish - Momentum: Potential bearish reversal - Volatility: Consolidation phase - Volume: Neutral sentiment
Final Verdict:
Considering the mixed signals from the technical indicators, the next few days for HYZD are likely to see sideways movement with a slight bearish bias. Traders should exercise caution and closely monitor key support and resistance levels for potential trading opportunities.