Technical Analysis of HYUP 2024-05-10
Overview:
In analyzing the technical indicators for HYUP stock over the last 5 days, we will delve into the trend, momentum, volatility, and volume indicators to provide a comprehensive assessment of the stock's potential price movement. By examining these key factors, we aim to offer valuable insights and predictions for the next few days.
Trend Indicators:
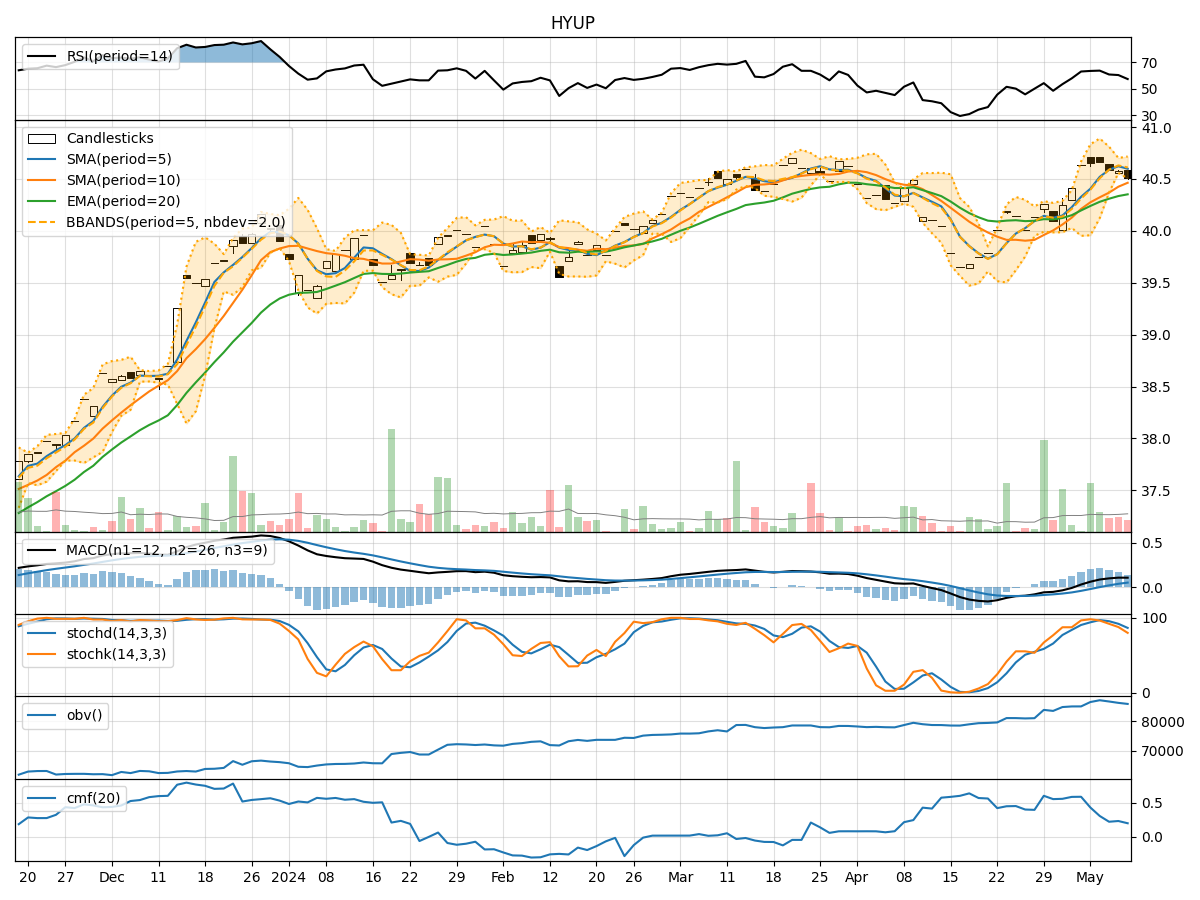
- Moving Averages (MA): The 5-day Moving Average (MA) has been consistently above the Simple Moving Average (SMA) and Exponential Moving Average (EMA), indicating a bullish trend.
- MACD: The Moving Average Convergence Divergence (MACD) has shown positive values, with the MACD line consistently above the Signal line, suggesting upward momentum.
- Conclusion: The trend indicators suggest an upward trend for HYUP stock.
Momentum Indicators:
- RSI: The Relative Strength Index (RSI) has been fluctuating around the 60-70 range, indicating moderate momentum.
- Stochastic Oscillator: Both %K and %D have been gradually decreasing, signaling a potential slowdown in momentum.
- Conclusion: The momentum indicators suggest a neutral to slightly bearish momentum for HYUP stock.
Volatility Indicators:
- Bollinger Bands (BB): The stock price has mostly stayed within the Bollinger Bands, with the bands narrowing over the last few days, indicating decreasing volatility.
- Conclusion: The volatility indicators suggest a decreasing volatility for HYUP stock.
Volume Indicators:
- On-Balance Volume (OBV): The OBV has shown a slight decrease over the last few days, indicating a potential decrease in buying pressure.
- Chaikin Money Flow (CMF): The CMF has also decreased, suggesting a decrease in the money flow into the stock.
- Conclusion: The volume indicators suggest a decreasing buying pressure for HYUP stock.
Overall Conclusion:
Based on the analysis of trend, momentum, volatility, and volume indicators, the overall outlook for HYUP stock in the next few days is as follows: - Trend: The trend indicators point to an upward trend. - Momentum: The momentum indicators suggest a neutral to slightly bearish momentum. - Volatility: The volatility indicators indicate a decreasing volatility. - Volume: The volume indicators show a decreasing buying pressure.
Final Verdict:
Considering the overall analysis, while the trend remains bullish, the weakening momentum and decreasing buying pressure could potentially lead to a sideways consolidation or a minor pullback in the stock price in the next few days. Traders should closely monitor key support and resistance levels for potential entry or exit points.