Technical Analysis of HYTR 2024-05-10
Overview:
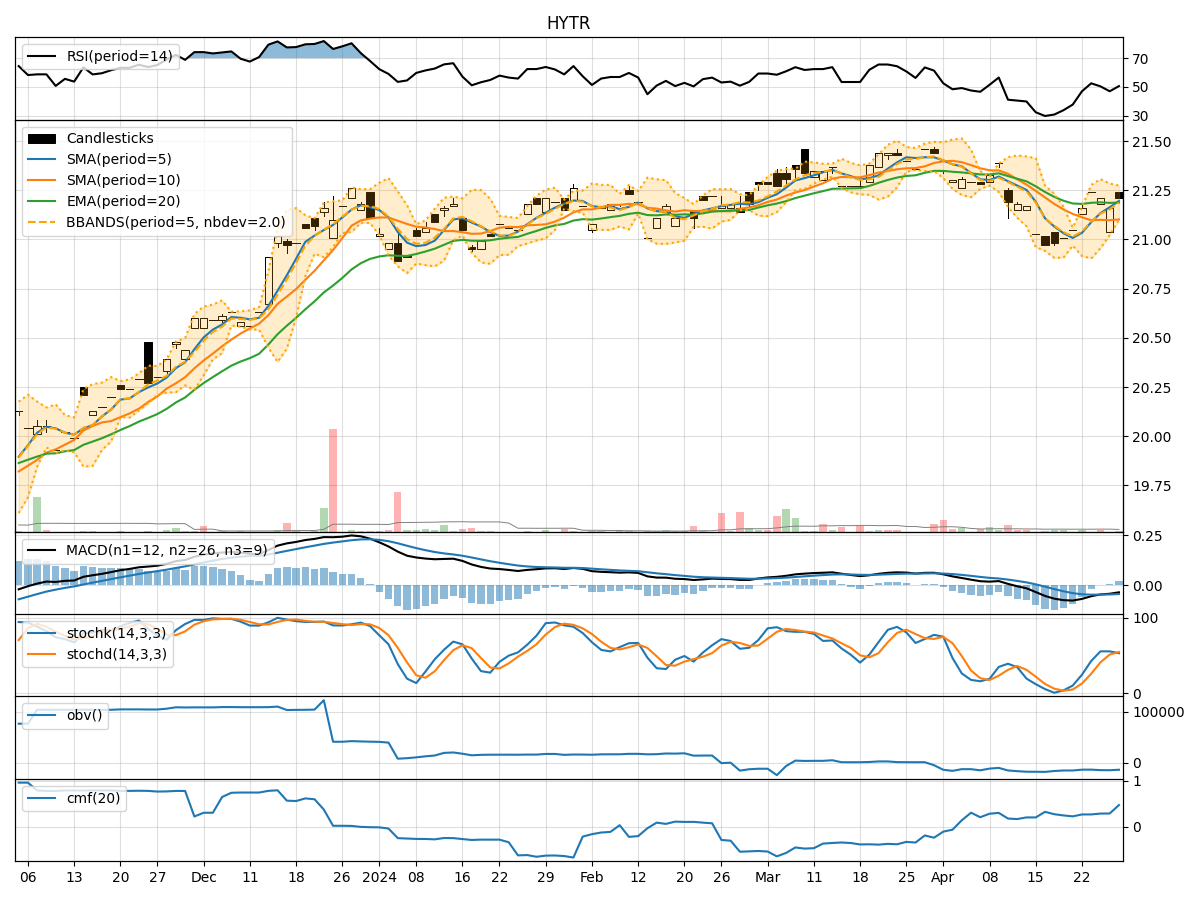
In analyzing the technical indicators for HYTR over the last 5 days, we will delve into the trend, momentum, volatility, and volume indicators to provide a comprehensive outlook on the possible stock price movement in the coming days.
Trend Analysis:
- Moving Averages (MA): The 5-day Moving Average (MA) has been consistently above the Simple Moving Average (SMA) and Exponential Moving Average (EMA), indicating a bullish trend.
- MACD: The MACD line has been consistently above the signal line, with both lines showing an upward trend, suggesting bullish momentum.
- Conclusion: The trend indicators point towards an upward trend in the stock price.
Momentum Analysis:
- RSI: The Relative Strength Index (RSI) has been fluctuating around the 60-65 range, indicating moderate momentum.
- Stochastic Oscillator: Both %K and %D have been gradually decreasing, suggesting a potential slowdown in momentum.
- Conclusion: The momentum indicators suggest a neutral to slightly bearish momentum in the stock price.
Volatility Analysis:
- Bollinger Bands: The stock price has been trading within the Bollinger Bands, with the bands narrowing over the last few days, indicating decreasing volatility.
- Conclusion: Volatility indicators signal a decreasing volatility in the stock price.
Volume Analysis:
- On-Balance Volume (OBV): The OBV has been relatively stable, showing a slight decrease in volume over the last few days.
- Chaikin Money Flow (CMF): The CMF has been negative, indicating a net outflow of money from the stock.
- Conclusion: Volume indicators suggest a decreasing volume and negative money flow in the stock.
Conclusion:
Based on the analysis of the technical indicators: - Trend: The trend indicators point towards an upward trend. - Momentum: Momentum indicators suggest a neutral to slightly bearish momentum. - Volatility: Volatility indicators signal a decreasing volatility. - Volume: Volume indicators suggest a decreasing volume and negative money flow.
Overall Assessment:
Considering the mixed signals from momentum and volume indicators against the backdrop of a bullish trend and decreasing volatility, the next few days' stock price movement for HYTR is likely to be sideways with a slight bearish bias. Traders should exercise caution and closely monitor key support and resistance levels for potential entry or exit points.