Technical Analysis of HYRM 2024-05-10
Overview:
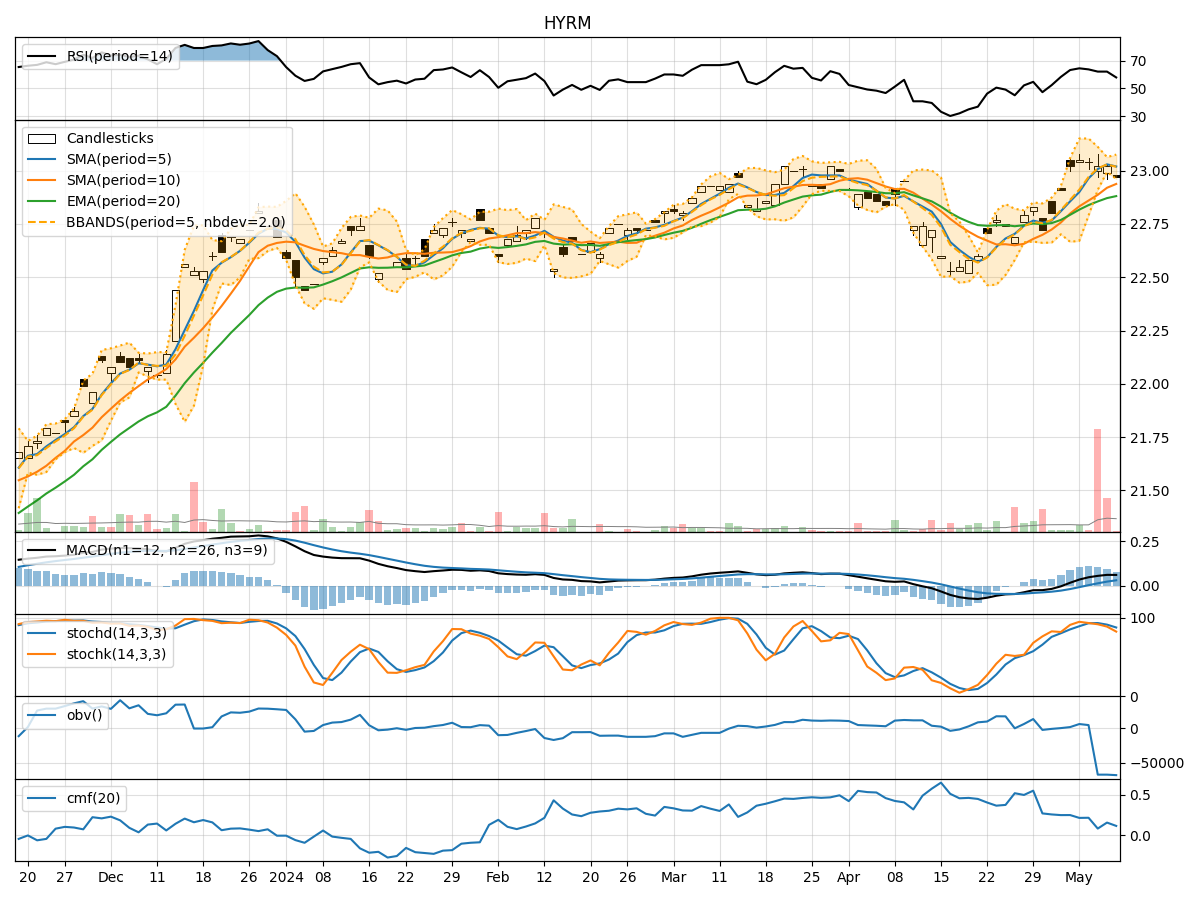
In analyzing the technical indicators for HYRM over the last 5 days, we will delve into the trend, momentum, volatility, and volume indicators to provide a comprehensive outlook on the possible stock price movement. By examining these key aspects, we aim to offer valuable insights and predictions for the upcoming days.
Trend Analysis:
- Moving Averages (MA): The 5-day MA has been consistently above the closing prices, indicating a short-term uptrend.
- MACD: The MACD line has been above the signal line, suggesting bullish momentum.
- EMA: The EMA has been trending upwards, supporting the bullish sentiment.
Key Observation: The trend indicators point towards a bullish outlook for HYRM.
Momentum Analysis:
- RSI: The RSI has been in the overbought territory, indicating strong buying momentum.
- Stochastic Oscillator: Both %K and %D have been declining but remain in the overbought zone.
- Williams %R: The indicator is in the oversold region, suggesting a potential reversal.
Key Observation: Momentum indicators show a mixed signal with some overbought conditions.
Volatility Analysis:
- Bollinger Bands (BB): The stock price has been trading within the bands, indicating moderate volatility.
- Bollinger %B: The %B is hovering around the midline, suggesting a balanced market sentiment.
Key Observation: Volatility indicators suggest a sideways movement in the stock price.
Volume Analysis:
- On-Balance Volume (OBV): The OBV has been fluctuating, indicating indecision among investors.
- Chaikin Money Flow (CMF): The CMF has been positive but declining, signaling potential profit-taking.
Key Observation: Volume indicators reflect uncertainty in market participation.
Conclusion:
Based on the analysis of trend, momentum, volatility, and volume indicators, the next few days for HYRM could see upward movement in line with the bullish trend. However, the mixed momentum signals and uncertain volume patterns suggest a need for caution. The stock may experience consolidation in the near term before potentially resuming its upward trajectory.
Recommendation:
- Short-term Traders: Consider taking profits as the stock may consolidate.
- Long-term Investors: Hold positions with a watchful eye on key support levels.
- Risk Management: Set stop-loss orders to protect gains in case of a sudden reversal.
Overall, while the trend remains bullish, it is essential to monitor momentum shifts and volume dynamics for a well-rounded assessment of HYRM's price action.