Technical Analysis of HYDB 2024-05-10
Overview:
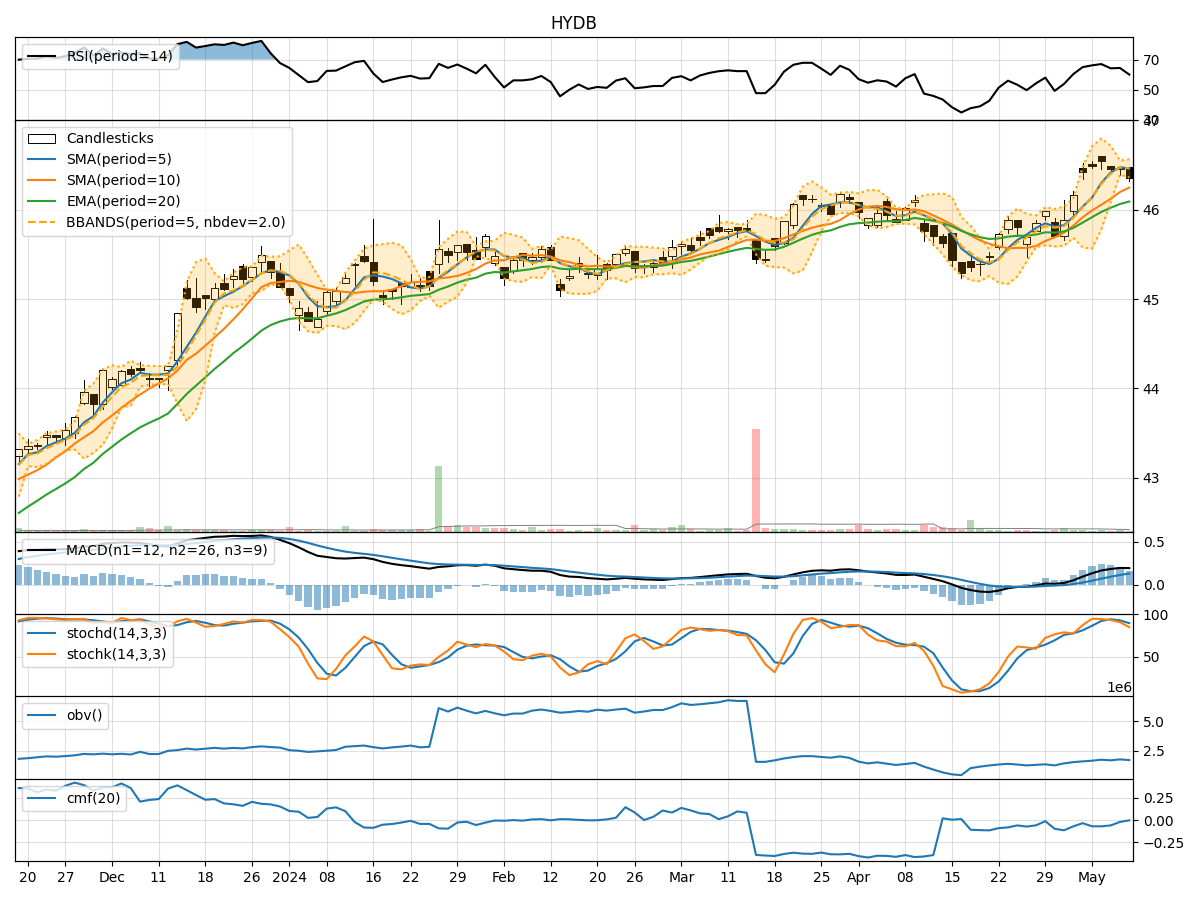
In analyzing the technical indicators for HYDB stock over the last 5 days, we will delve into the trend, momentum, volatility, and volume indicators to provide a comprehensive outlook on the possible stock price movement in the coming days. By examining these key indicators, we aim to offer valuable insights and predictions for potential investors.
Trend Indicators:
- Moving Averages (MA): The 5-day MA has been consistently above the closing prices, indicating a bullish trend.
- MACD: The MACD line has been above the signal line, suggesting a positive momentum in the stock price.
- EMA: The EMA has been trending upwards, reflecting a bullish sentiment in the market.
Momentum Indicators:
- RSI: The RSI has been fluctuating around the overbought territory, indicating strong buying momentum.
- Stochastic Oscillator: Both %K and %D have been in the overbought zone, signaling a potential reversal.
- Williams %R: The indicator has been in the oversold region, suggesting a possible buying opportunity.
Volatility Indicators:
- Bollinger Bands (BB): The bands have been narrowing, indicating decreasing volatility and a potential breakout.
- BB %B: The %B indicator is close to the lower band, suggesting a possible oversold condition.
- BB Width: The narrowing of the bands suggests a period of consolidation.
Volume Indicators:
- On-Balance Volume (OBV): The OBV has been fluctuating, indicating indecision among investors.
- Chaikin Money Flow (CMF): The CMF has been negative, reflecting selling pressure in the stock.
Key Observations:
- The trend indicators suggest a bullish sentiment in the stock price.
- Momentum indicators show mixed signals with overbought and oversold conditions.
- Volatility indicators point towards a period of consolidation.
- Volume indicators indicate indecision among investors with selling pressure prevailing.
Conclusion:
Based on the analysis of the technical indicators, the next few days for HYDB stock could see sideways movement with a slight bias towards a bullish outlook. Investors should closely monitor the stochastic oscillator for a potential reversal in momentum and keep an eye on the Bollinger Bands for a breakout signal. It is advisable to wait for confirmation from multiple indicators before making any trading decisions.