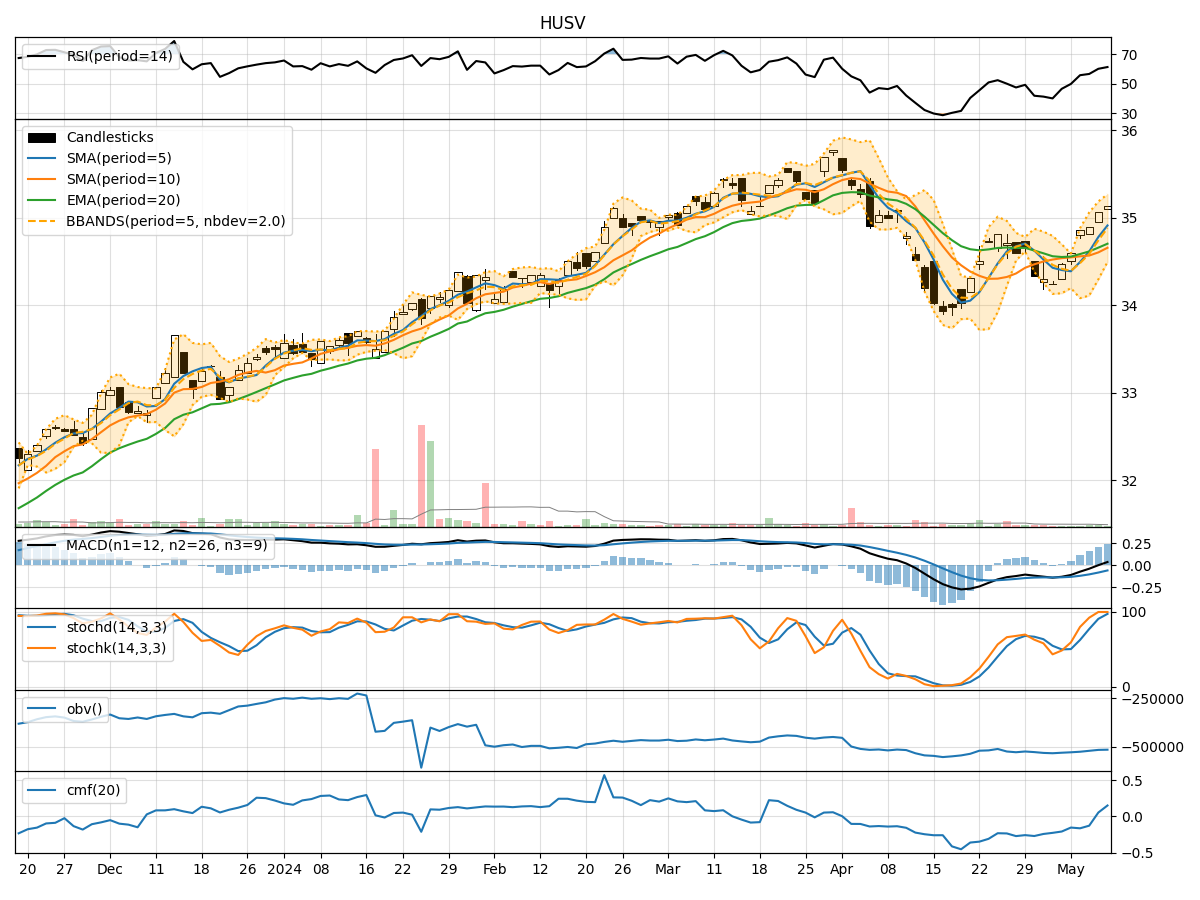
Technical Analysis of HUSV 2024-05-10
Overview:
In analyzing the technical indicators for HUSV over the last 5 days, we will delve into the trend, momentum, volatility, and volume indicators to provide a comprehensive outlook on the possible stock price movement in the coming days. By examining these key aspects, we aim to offer valuable insights and predictions for potential investors.
Trend Analysis:
- Moving Averages (MA): The 5-day Moving Average (MA) has been consistently above the Simple Moving Average (SMA) and Exponential Moving Average (EMA), indicating a short-term bullish trend.
- MACD: The MACD line has been consistently above the signal line, with both lines showing an upward trend, suggesting bullish momentum.
- RSI: The Relative Strength Index (RSI) has been gradually increasing and is currently in the neutral zone, indicating potential for further price movement.
Momentum Analysis:
- Stochastic Oscillator: The Stochastic Oscillator is in the overbought zone, suggesting a potential reversal or consolidation in the near future.
- Williams %R: The Williams %R is in the oversold territory, indicating a possible buying opportunity.
Volatility Analysis:
- Bollinger Bands (BB): The price has been trading within the Bollinger Bands, with the bands widening slightly, indicating increased volatility.
- BB% (Bollinger Band %B): The %B indicator is below 1, suggesting the price is trading below the lower band, potentially indicating an oversold condition.
Volume Analysis:
- On-Balance Volume (OBV): The OBV has been fluctuating, indicating indecision among investors regarding the stock.
- Chaikin Money Flow (CMF): The CMF has been negative, reflecting selling pressure in the stock.
Key Observations:
- The trend indicators suggest a bullish sentiment in the short term.
- Momentum indicators show conflicting signals, with the Stochastic Oscillator in the overbought zone and Williams %R in the oversold territory.
- Volatility has increased slightly, indicating potential price fluctuations.
- Volume indicators reflect mixed investor sentiment, with OBV showing selling pressure and CMF indicating negative money flow.
Conclusion:
Based on the analysis of the technical indicators, the stock price of HUSV is likely to experience further upward movement in the coming days, supported by the bullish trend indicated by moving averages and MACD. However, caution is advised due to conflicting signals from momentum indicators and increased volatility. Investors should closely monitor the price action and consider potential reversals or consolidations in the near term.