Technical Analysis of HTRB 2024-05-10
Overview:
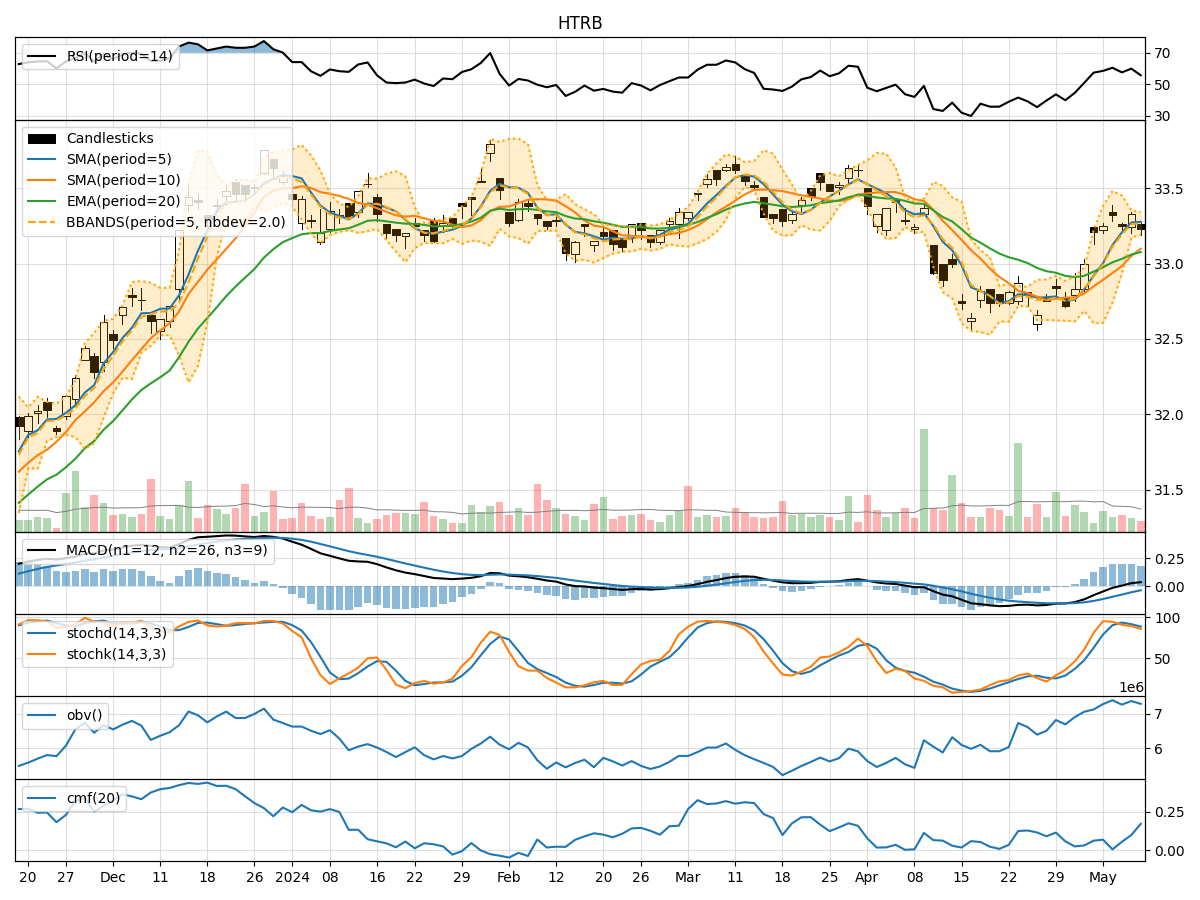
In the last 5 trading days, the stock has shown a relatively stable price movement with minor fluctuations. The trend indicators suggest a slightly bullish sentiment, supported by positive MACD values and increasing moving averages. Momentum indicators indicate a neutral to slightly bullish momentum, with RSI values hovering around the mid-range. Volatility indicators show a narrowing Bollinger Bands, indicating decreasing volatility. Volume indicators suggest a positive accumulation/distribution trend.
Trend Indicators Analysis:
- Moving Averages (MA): The 5-day MA is consistently above the 10-day SMA, indicating a short-term bullish trend.
- Exponential Moving Average (EMA): The EMA is trending upwards, supporting a bullish sentiment.
- Moving Average Convergence Divergence (MACD): The MACD line is above the signal line, indicating a bullish trend.
Key Observation: The trend indicators collectively suggest an upward trend in the stock price.
Momentum Indicators Analysis:
- Relative Strength Index (RSI): RSI values are in the neutral zone, indicating a balanced momentum.
- Stochastic Oscillator: Both %K and %D values are in the overbought region, suggesting a potential reversal.
- Williams %R (Willams %R): The indicator is in the oversold region, indicating a potential buying opportunity.
Key Observation: Momentum indicators show a neutral to slightly bullish sentiment.
Volatility Indicators Analysis:
- Bollinger Bands (BB): The bands are narrowing, indicating decreasing volatility and a potential price breakout.
Key Observation: Volatility indicators suggest a potential price breakout due to the narrowing Bollinger Bands.
Volume Indicators Analysis:
- On-Balance Volume (OBV): The OBV is showing a positive trend, indicating accumulation of the stock.
- Chaikin Money Flow (CMF): The CMF is positive, suggesting buying pressure in the stock.
Key Observation: Volume indicators support a bullish view with positive accumulation and buying pressure.
Conclusion:
Based on the analysis of trend, momentum, volatility, and volume indicators, the stock is likely to experience upward price movement in the next few days. The overall technical outlook is bullish, supported by positive trend indicators, neutral to slightly bullish momentum, decreasing volatility leading to a potential breakout, and positive volume accumulation. Traders and investors may consider taking long positions or holding onto existing positions to capitalize on the expected price appreciation. It is important to monitor the price action closely for any signs of reversal or trend continuation.