Technical Analysis of HSRT 2024-05-10
Overview:
In analyzing the technical indicators for HSRT stock over the last 5 days, we will delve into the trend, momentum, volatility, and volume indicators to provide a comprehensive outlook on the possible stock price movement in the coming days. By examining these key indicators, we aim to offer valuable insights and predictions for potential investors.
Trend Analysis:
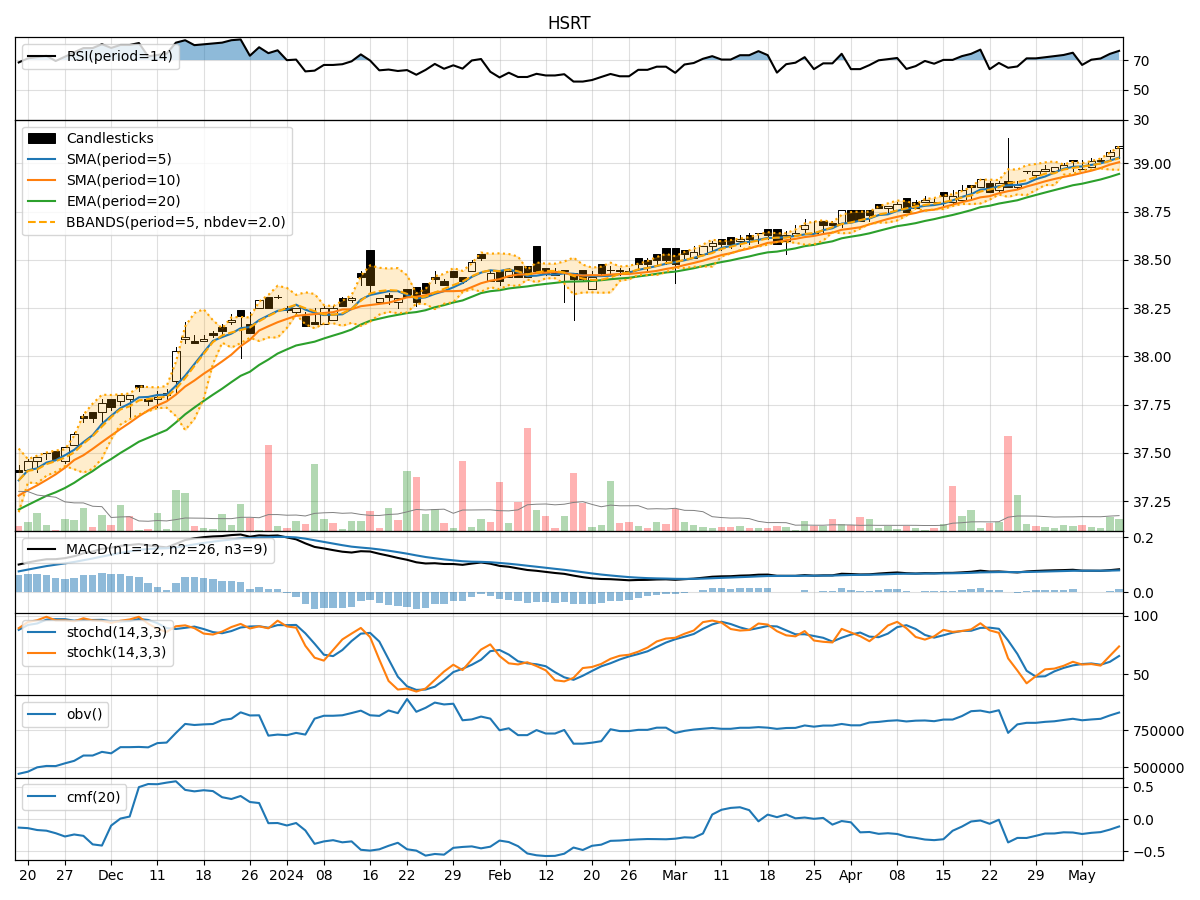
- Moving Averages (MA): The 5-day Moving Average (MA) has been consistently above the Simple Moving Average (SMA) and Exponential Moving Average (EMA), indicating a bullish trend.
- MACD: The MACD line has been consistently positive, with the MACD Histogram also showing an increasing trend, suggesting bullish momentum.
Momentum Analysis:
- RSI: The Relative Strength Index (RSI) has been trending upwards and is currently in the overbought territory, indicating strong buying momentum.
- Stochastic Oscillator: Both %K and %D lines of the Stochastic Oscillator are in the overbought zone, suggesting a potential reversal or consolidation.
Volatility Analysis:
- Bollinger Bands (BB): The stock price has been consistently trading above the middle Bollinger Band (BBM), indicating an uptrend with increasing volatility.
- Bollinger Band %B (BBP): The %B indicator has been fluctuating around 0.8, signifying a high volatility environment.
Volume Analysis:
- On-Balance Volume (OBV): The OBV indicator has been steadily increasing over the past 5 days, reflecting strong buying pressure.
- Chaikin Money Flow (CMF): The CMF indicator has been negative, suggesting some distribution in the stock.
Key Observations:
- The trend indicators suggest a strong bullish sentiment in the stock.
- Momentum indicators indicate overbought conditions, signaling a potential reversal or consolidation.
- Volatility indicators show increasing volatility, which could lead to larger price swings.
- Volume indicators reflect strong buying pressure but also some distribution.
Conclusion:
Based on the analysis of the technical indicators, the stock is currently in a strong bullish trend with high buying momentum. However, the overbought conditions indicated by the momentum indicators and the increasing volatility suggest a potential pullback or consolidation in the near future. Investors should closely monitor the price action for signs of a reversal or a continuation of the bullish trend. Exercise caution and consider taking profits or implementing risk management strategies in anticipation of a possible correction.