Technical Analysis of HFGO 2024-05-10
Overview:
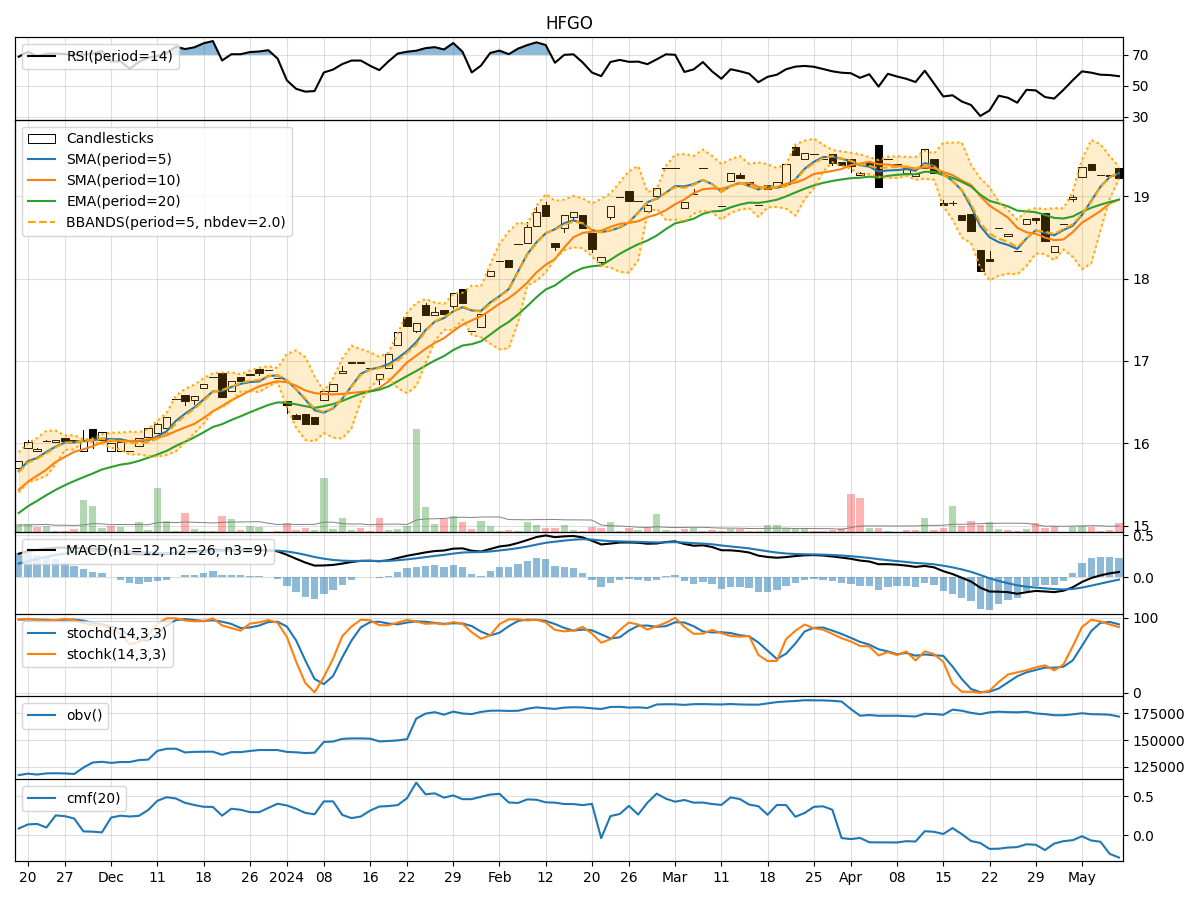
In analyzing the technical indicators for HFGO stock over the last 5 days, we will delve into the trend, momentum, volatility, and volume indicators to provide a comprehensive outlook on the possible future stock price movement. By examining these key indicators, we aim to offer valuable insights and predictions for the upcoming trading days.
Trend Analysis:
- Moving Averages (MA): The 5-day Moving Average (MA) has been consistently above the Simple Moving Average (SMA) and Exponential Moving Average (EMA), indicating a bullish trend.
- MACD: The MACD line has been consistently above the signal line, with both lines trending upwards, suggesting a bullish momentum.
- RSI: The Relative Strength Index (RSI) has been fluctuating around the 50 level, indicating a neutral stance in terms of momentum.
Momentum Analysis:
- Stochastic Oscillator: The Stochastic Oscillator has been in the overbought region, suggesting a potential reversal or consolidation in the near term.
- Williams %R: The Williams %R indicator has been consistently in the oversold territory, signaling a possible bullish reversal.
Volatility Analysis:
- Bollinger Bands (BB): The Bollinger Bands have been narrowing, indicating decreasing volatility and a potential breakout or significant price movement ahead.
Volume Analysis:
- On-Balance Volume (OBV): The OBV has been declining, suggesting selling pressure in the stock.
- Chaikin Money Flow (CMF): The CMF has been negative, indicating a bearish money flow trend.
Key Observations:
- The trend indicators suggest a bullish sentiment, supported by the MACD and moving averages.
- Momentum indicators show conflicting signals, with the Stochastic Oscillator in overbought territory and Williams %R in oversold territory.
- Volatility is decreasing, hinting at a potential price breakout or consolidation.
- Volume indicators reflect a bearish sentiment, with OBV and CMF showing negative trends.
Conclusion:
Based on the analysis of the technical indicators, the stock price of HFGO is likely to experience a period of consolidation in the near term. The conflicting signals from momentum indicators and the narrowing Bollinger Bands indicate a potential price range-bound movement. However, the overall bullish trend from the moving averages and MACD suggests a possible upward bias in the medium to long term. Traders should exercise caution and closely monitor key support and resistance levels for potential trading opportunities.