Technical Analysis of HEGD 2024-05-10
Overview:
In analyzing the technical indicators for HEGD over the last 5 days, we will delve into the trend, momentum, volatility, and volume indicators to provide a comprehensive outlook on the possible stock price movement in the coming days. By examining these key indicators, we aim to offer valuable insights and predictions for informed decision-making.
Trend Indicators:
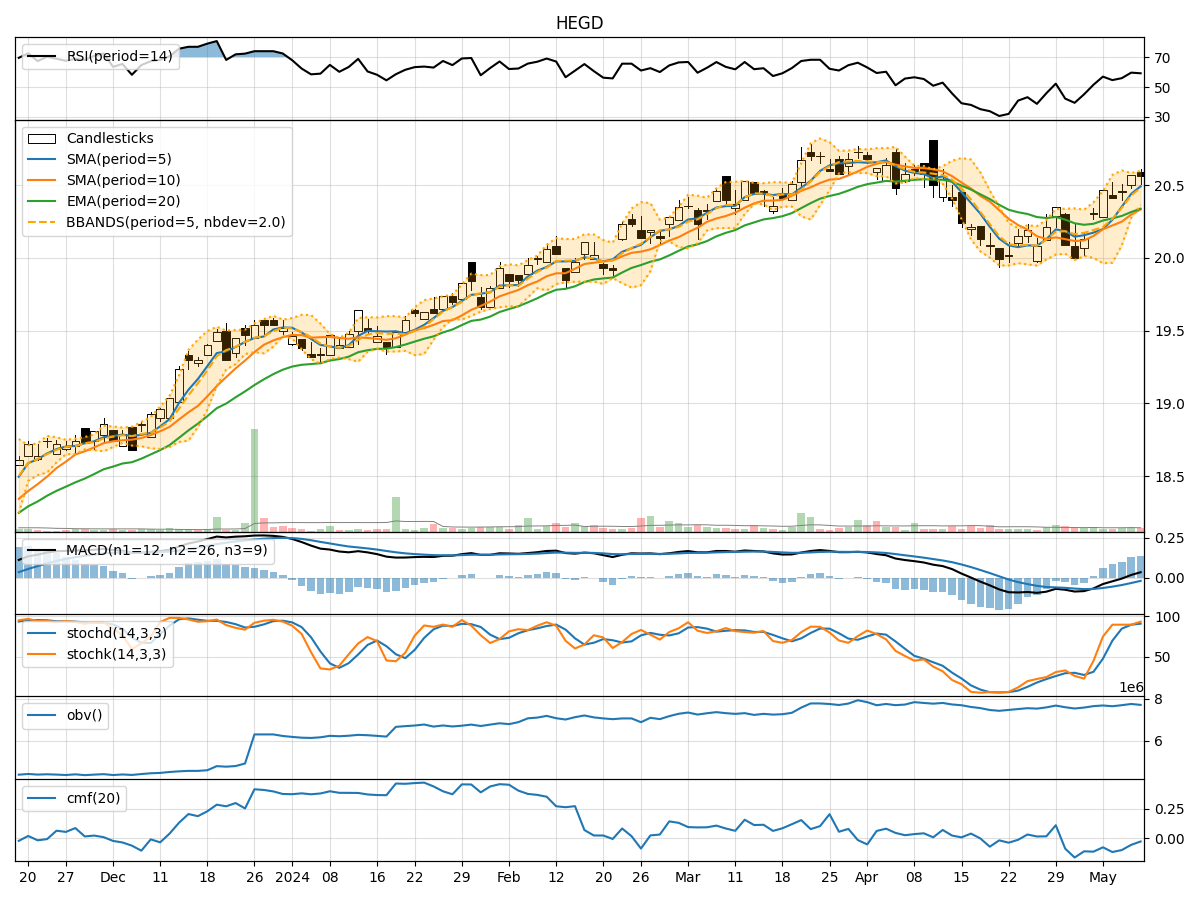
- Moving Averages (MA): The 5-day MA has been consistently above the closing prices, indicating a short-term uptrend.
- MACD: The MACD line has been positive, with the MACD histogram showing an increasing trend, suggesting bullish momentum.
- EMA: The EMA has been trending upwards, supporting the bullish sentiment in the short to medium term.
Momentum Indicators:
- RSI: The RSI has been fluctuating around the neutral zone, indicating a balanced momentum between buying and selling pressure.
- Stochastic Oscillator: Both %K and %D have been in the overbought territory, signaling a potential reversal or consolidation.
- Williams %R: The indicator has been hovering near oversold levels, suggesting a possible buying opportunity.
Volatility Indicators:
- Bollinger Bands (BB): The bands have been relatively narrow, indicating low volatility and a potential breakout in either direction.
- BB %B: The %B indicator has been fluctuating within a tight range, reflecting indecision in the market.
- Average True Range (ATR): The ATR has been relatively stable, suggesting a lack of significant price fluctuations.
Volume Indicators:
- On-Balance Volume (OBV): The OBV has shown mixed signals, reflecting uncertainty in the accumulation/distribution of the stock.
- Chaikin Money Flow (CMF): The CMF has been negative, indicating selling pressure in the market.
Key Observations:
- The trend indicators suggest a bullish bias in the short to medium term.
- Momentum indicators show a mixed sentiment with potential for a reversal or consolidation.
- Volatility indicators point towards a potential breakout as volatility remains low.
- Volume indicators reflect uncertainty in market participation and accumulation/distribution.
Conclusion:
Based on the analysis of the technical indicators, the stock price of HEGD is likely to experience sideways consolidation in the coming days. While the trend indicators support a bullish view, the mixed signals from momentum, volatility, and volume indicators suggest a period of indecision and potential range-bound trading. Traders should exercise caution and wait for clearer signals before taking significant positions.