Technical Analysis of GSLC 2024-05-10
Overview:
In analyzing the technical indicators for GSLC over the last 5 days, we will delve into the trend, momentum, volatility, and volume indicators to provide a comprehensive outlook on the possible stock price movement. By examining these key indicators, we aim to offer valuable insights and predictions for the upcoming days.
Trend Indicators:
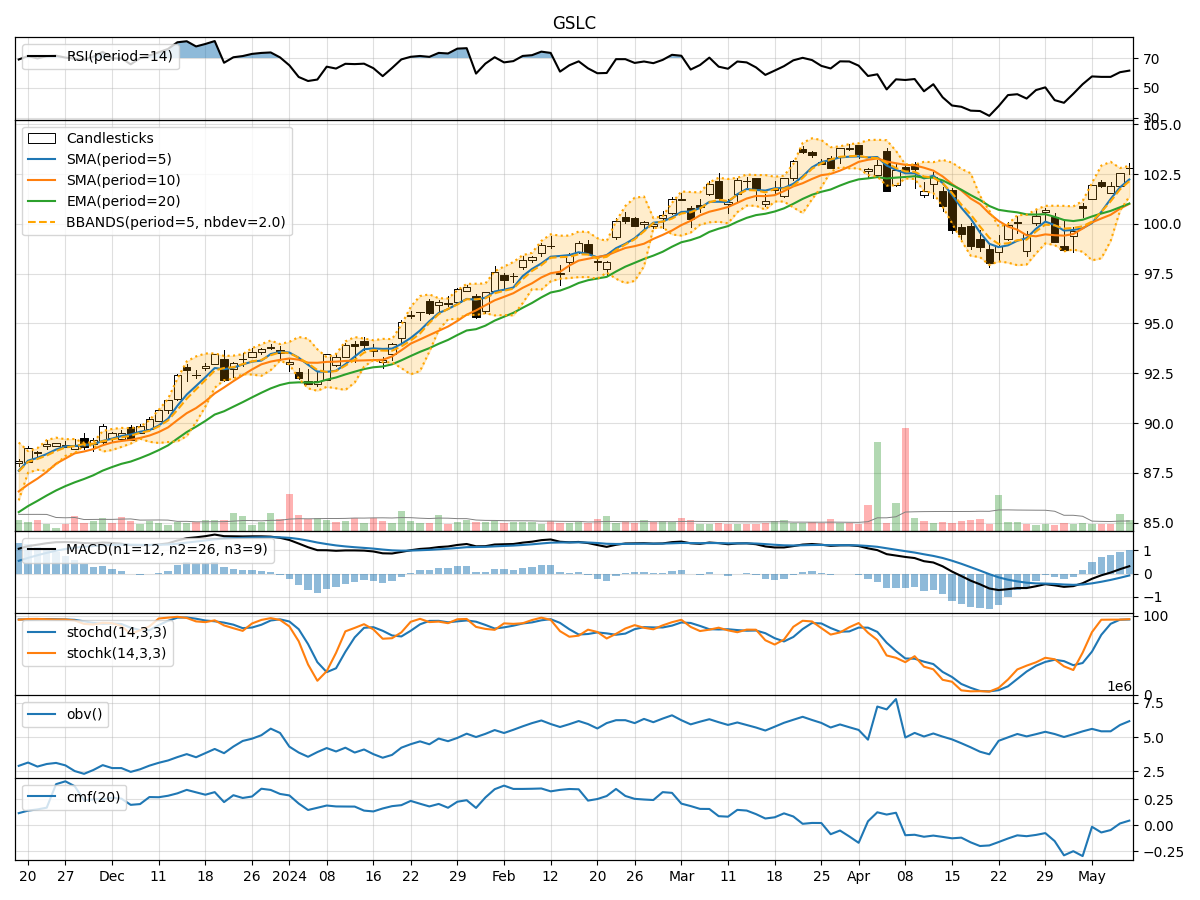
- Moving Averages (MA): The 5-day MA has been consistently above the 10-day SMA, indicating a short-term bullish trend.
- MACD: The MACD line has been consistently above the signal line, suggesting bullish momentum.
- EMA: The EMA has been trending upwards, supporting the bullish sentiment in the short to medium term.
Key Observation: The trend indicators point towards a bullish outlook for GSLC.
Momentum Indicators:
- RSI: The RSI has been gradually increasing, indicating strengthening buying momentum.
- Stochastic Oscillator: Both %K and %D have been in the overbought territory, suggesting a strong bullish momentum.
- Williams %R: The indicator has been fluctuating around the oversold region, indicating potential buying opportunities.
Key Observation: Momentum indicators signal a strong bullish sentiment for GSLC.
Volatility Indicators:
- Bollinger Bands (BB): The stock price has been trading within the bands, with the %B indicating a moderate level of volatility.
- Average True Range (ATR): The ATR has been relatively stable, suggesting consistent price movements.
- Bollinger Band Width: The band width has been narrowing, indicating a potential decrease in volatility.
Key Observation: Volatility indicators suggest a stable market environment for GSLC.
Volume Indicators:
- On-Balance Volume (OBV): The OBV has shown mixed signals, with some days experiencing selling pressure and others showing accumulation.
- Chaikin Money Flow (CMF): The CMF has been negative, indicating some distribution in the stock.
Key Observation: Volume indicators reflect mixed signals for GSLC.
Conclusion:
Based on the analysis of trend, momentum, volatility, and volume indicators, the overall outlook for GSLC in the next few days is strongly bullish. The trend indicators support a continued upward movement, while momentum indicators suggest a robust buying sentiment. Volatility remains stable, indicating a predictable price range, and volume indicators, although mixed, do not negate the bullish outlook.
Therefore, the next few days are likely to see an upward movement in GSLC's stock price. Investors may consider taking advantage of potential buying opportunities in line with the bullish trend.