Technical Analysis of GSEW 2024-05-10
Overview:
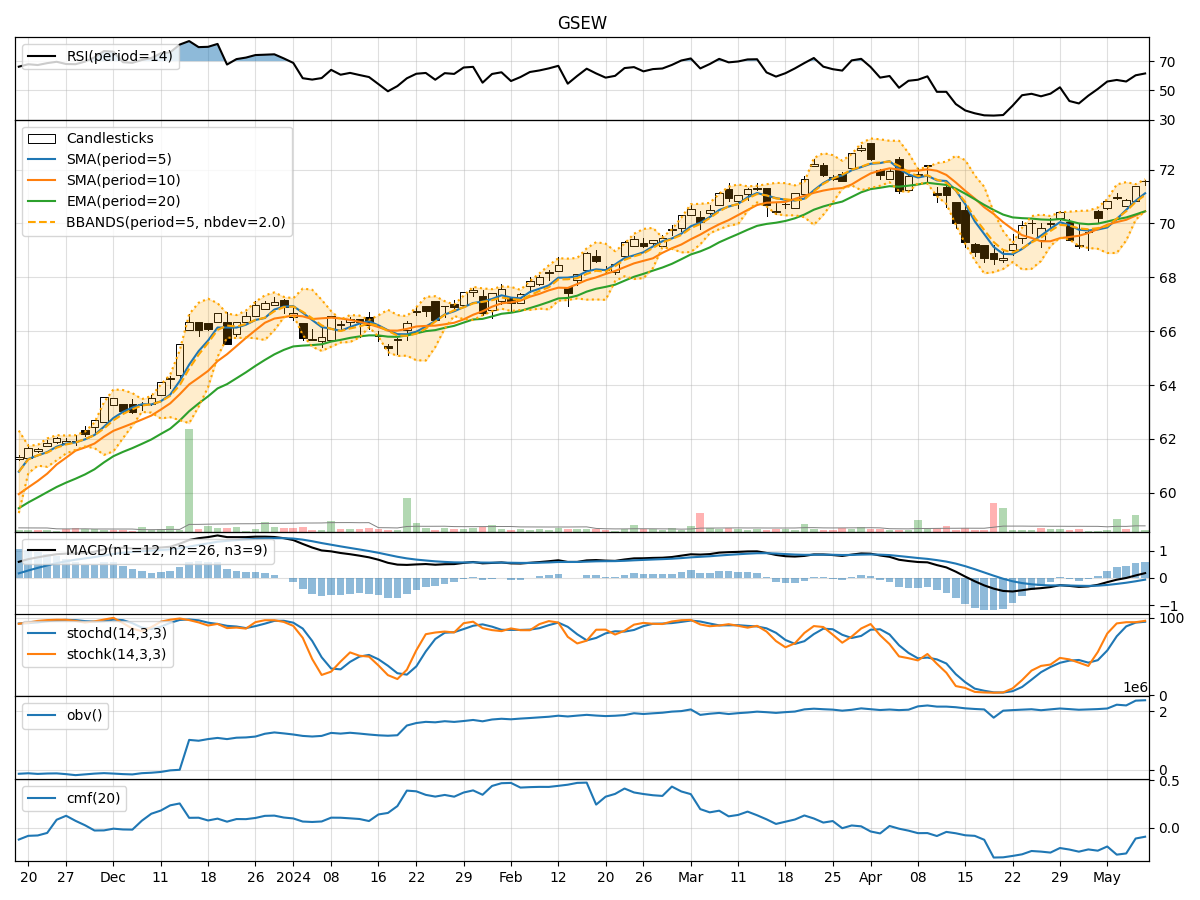
In the last 5 trading days, GSEW stock has shown a consistent uptrend in price, supported by increasing volumes. The moving averages have been trending upwards, and momentum indicators like RSI and Stochastic oscillators are in overbought territory. Volatility indicators suggest a narrowing of price range, and volume indicators show a mixed sentiment. Let's delve deeper into each category of technical indicators to provide a comprehensive analysis and make a prediction for the next few days.
Trend Indicators:
- Moving Averages (MA): The 5-day MA has been consistently above the longer-term SMAs, indicating a short-term bullish trend. The EMA has been rising steadily, reflecting the recent price momentum.
- MACD: The MACD line has been above the signal line, with both lines trending upwards. The MACD histogram has been increasing, indicating strengthening bullish momentum.
Momentum Indicators:
- RSI: The RSI has been in the overbought zone, suggesting a potential reversal or consolidation in the near term.
- Stochastic Oscillators: Both %K and %D have been in the overbought region, indicating a potential pullback or sideways movement.
- Williams %R: The indicator has been hovering near oversold levels, signaling a potential reversal to the upside.
Volatility Indicators:
- Bollinger Bands (BB): The bands have been narrowing, indicating decreasing volatility and a potential period of consolidation or a breakout.
- Bollinger %B: The %B indicator has been fluctuating within a tight range, suggesting a lack of clear direction in price movement.
Volume Indicators:
- On-Balance Volume (OBV): The OBV has been trending upwards, indicating accumulation by investors.
- Chaikin Money Flow (CMF): The CMF has been negative, suggesting some distribution pressure despite the rising price.
Key Observations and Opinions:
- Trend: The stock is in a strong uptrend based on moving averages and MACD, indicating a bullish bias.
- Momentum: Overbought conditions on RSI and Stochastic suggest a potential pullback or consolidation.
- Volatility: Decreasing volatility as per Bollinger Bands may lead to a period of consolidation before a potential breakout.
- Volume: Mixed signals from OBV and CMF indicate a divergence in investor sentiment.
Conclusion:
Based on the analysis of technical indicators, the next few days for GSEW stock could see a potential consolidation phase with a slight bias towards a bullish continuation. Traders should watch for signs of a breakout above the recent high or a pullback towards key support levels. It is advisable to monitor price action closely and consider risk management strategies to navigate potential market fluctuations.