Technical Analysis of GNMA 2024-05-10
Overview:
In analyzing the technical indicators for GNMA over the last 5 days, we will delve into the trend, momentum, volatility, and volume indicators to provide a comprehensive outlook on the possible stock price movement in the coming days. By examining these key indicators, we aim to offer valuable insights and predictions to guide your investment decisions.
Trend Analysis:
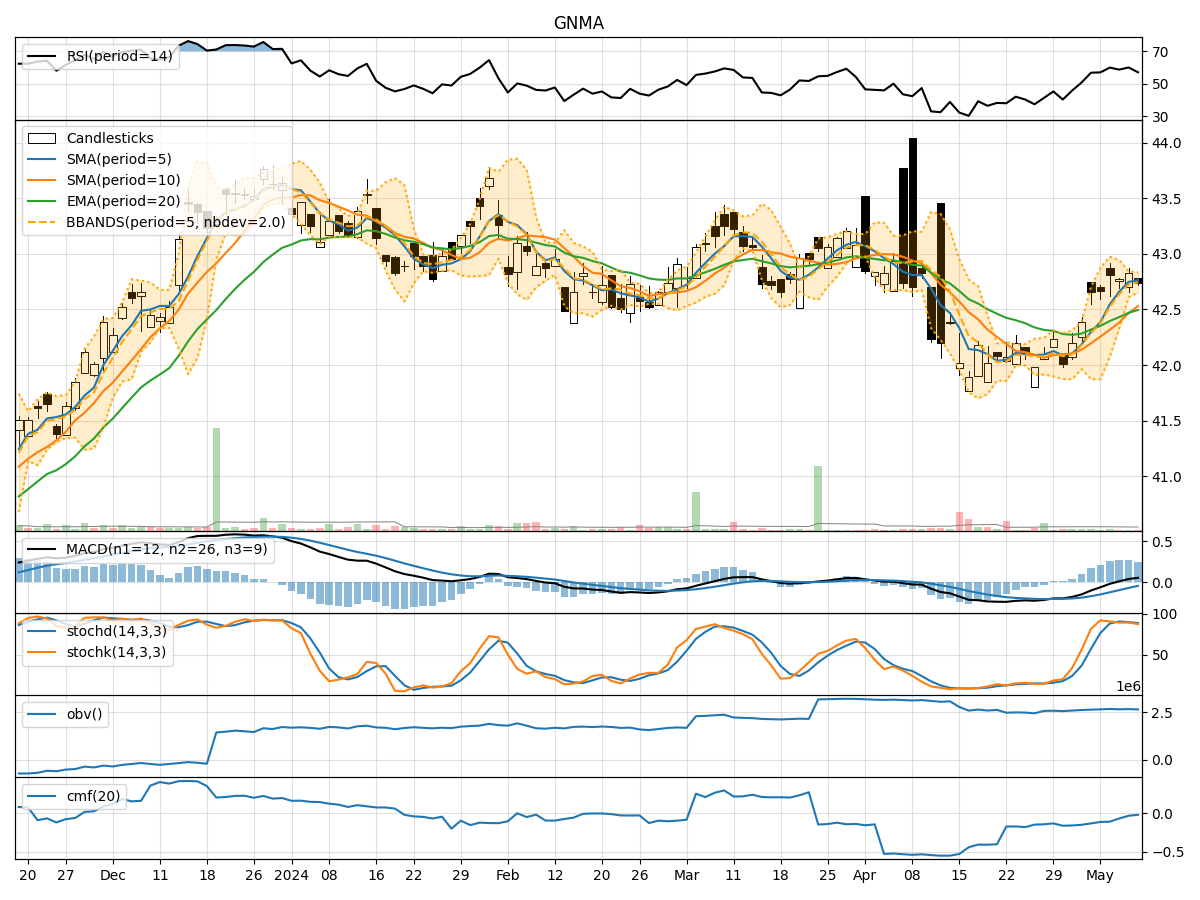
- Moving Averages (MA): The 5-day Moving Average (MA) has been consistently above the Simple Moving Average (SMA) and Exponential Moving Average (EMA), indicating a bullish trend.
- MACD: The Moving Average Convergence Divergence (MACD) has shown positive values, with the MACD line consistently above the Signal line, suggesting bullish momentum.
Momentum Analysis:
- RSI: The Relative Strength Index (RSI) has been fluctuating around the 60-65 range, indicating a neutral to slightly bullish momentum.
- Stochastic Oscillator: Both %K and %D values have been gradually decreasing, signaling a potential reversal from overbought conditions.
Volatility Analysis:
- Bollinger Bands (BB): The stock price has been trading within the Bollinger Bands, with the bands narrowing, indicating decreasing volatility.
Volume Analysis:
- On-Balance Volume (OBV): The OBV has been relatively stable, showing no significant divergence from price movements.
- Chaikin Money Flow (CMF): The CMF has been negative, suggesting a slight outflow of money from the stock.
Key Observations:
- The trend indicators suggest a bullish sentiment, supported by the positive MACD values and the MA positioning.
- Momentum indicators show a neutral to slightly bullish momentum, with the RSI hovering around the mid-range.
- Volatility has been decreasing, as indicated by the narrowing Bollinger Bands.
- Volume indicators reflect a stable volume with a slight outflow of money, as seen in the negative CMF.
Conclusion:
Based on the analysis of the technical indicators, the next few days' possible stock price movement for GNMA is likely to be sideways with a slight bullish bias. The bullish trend indicated by the moving averages and MACD may support some upward movement, but the neutral to slightly bullish momentum and decreasing volatility suggest a potential consolidation phase. Traders should closely monitor key support and resistance levels for potential breakout or reversal signals.
Recommendation:
- Consider setting tight stop-loss orders to manage risk during periods of consolidation.
- Monitor key technical levels, such as the MA crossovers and Bollinger Bands, for potential entry or exit points.
- Stay vigilant for any significant shifts in momentum or volume that could signal a change in the stock's direction.
By combining insights from trend, momentum, volatility, and volume indicators, investors can make more informed decisions and adapt their strategies to the evolving market conditions.