Technical Analysis of GLDM 2024-05-31
Overview:
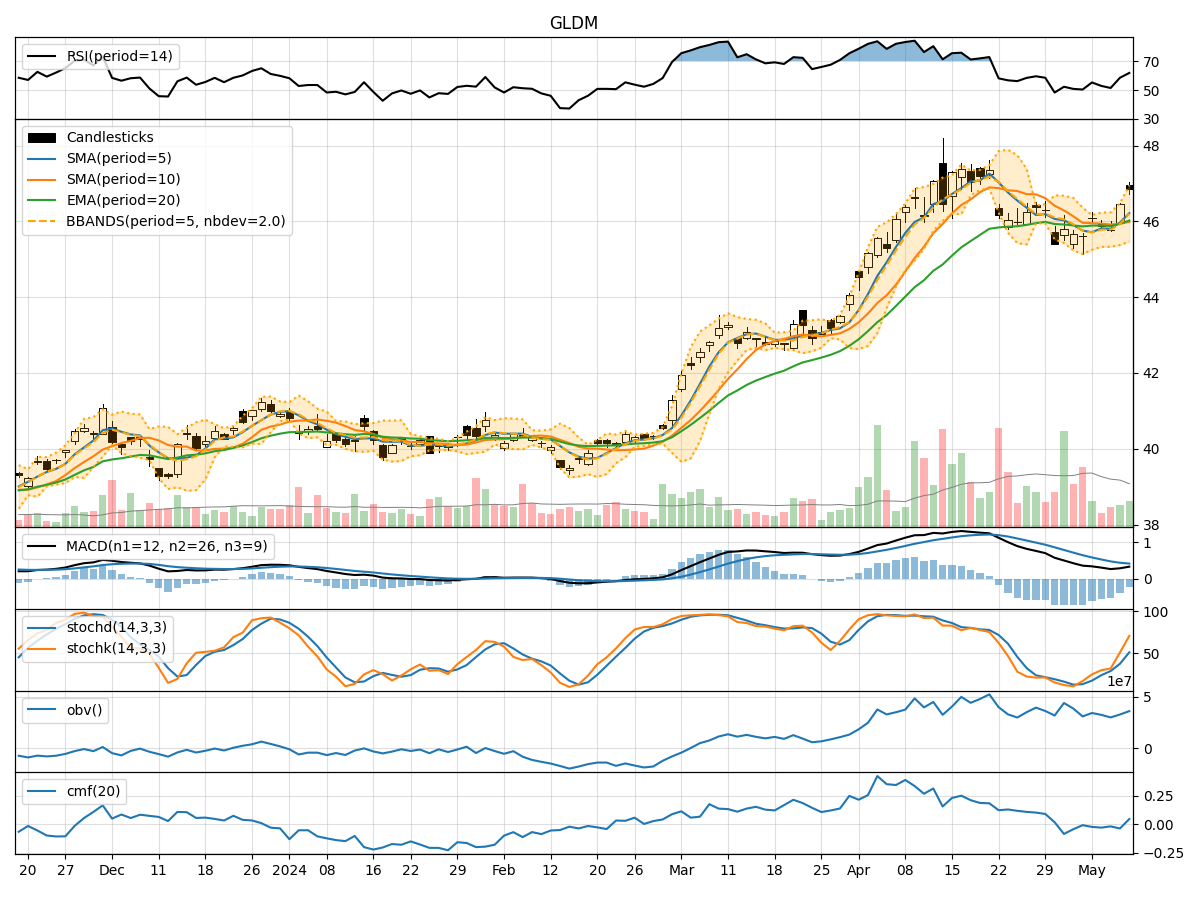
In analyzing the technical indicators for GLDM over the last 5 days, we will delve into the trend, momentum, volatility, and volume indicators to provide a comprehensive outlook on the possible stock price movement in the coming days.
Trend Analysis:
- Moving Averages (MA): The 5-day Moving Average (MA) has been consistently below the Simple Moving Average (SMA) and Exponential Moving Average (EMA), indicating a downward trend.
- MACD: The MACD line has been decreasing, with the MACD line below the signal line, suggesting a bearish trend.
- RSI: The Relative Strength Index (RSI) has been fluctuating around the 50 level, indicating indecision in the market.
Momentum Analysis:
- Stochastic Oscillator: Both %K and %D have been declining, showing a bearish momentum.
- Williams %R: The Williams %R is in oversold territory, suggesting a potential reversal.
Volatility Analysis:
- Bollinger Bands: The stock price has been trading within the Bollinger Bands, indicating a period of consolidation.
- Bollinger %B: The %B indicator is hovering around 0.5, reflecting a neutral stance.
Volume Analysis:
- On-Balance Volume (OBV): The OBV has been relatively flat, indicating a balance between buying and selling pressure.
- Chaikin Money Flow (CMF): The CMF has been positive but decreasing, signaling a potential outflow of money from the stock.
Key Observations:
- The trend indicators suggest a bearish sentiment with the stock trading below key moving averages.
- Momentum indicators point towards a weakening momentum in favor of the bears.
- Volatility indicators indicate a period of consolidation with no clear direction.
- Volume indicators show a lack of significant buying or selling pressure.
Conclusion:
Based on the analysis of the technical indicators, the outlook for GLDM in the next few days is bearish. The stock is likely to experience further downward pressure as the trend remains negative, momentum favors the bears, and volatility suggests consolidation. Traders should exercise caution and consider short-term selling opportunities until there is a clear reversal in the technical signals.