Technical Analysis of GHMS 2024-05-10
Overview:
In analyzing the technical indicators for GHMS over the last 5 days, we will delve into the trend, momentum, volatility, and volume indicators to provide a comprehensive outlook on the possible stock price movement in the coming days. By examining these key indicators, we aim to offer valuable insights and predictions to guide investment decisions.
Trend Analysis:
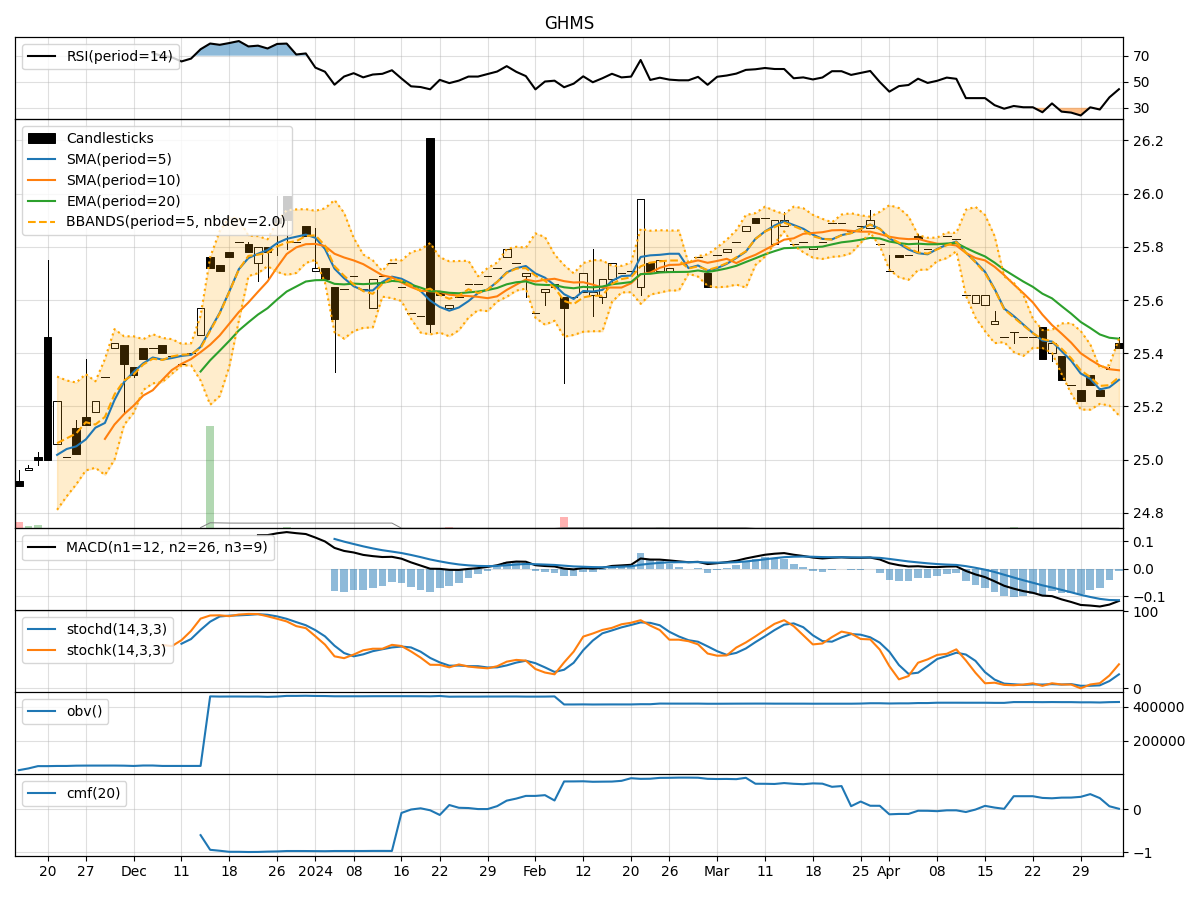
- Moving Averages (MA): The 5-day Moving Average (MA) has been consistently above the Simple Moving Average (SMA) and Exponential Moving Average (EMA), indicating a bullish trend.
- MACD: The MACD line has been negative but trending upwards, while the MACD Histogram has been consistently increasing, suggesting a potential bullish reversal.
Momentum Analysis:
- RSI: The Relative Strength Index (RSI) has been fluctuating around the neutral 50 level, indicating a lack of strong momentum in either direction.
- Stochastic Oscillator: Both %K and %D have been in overbought territory, signaling a potential reversal or consolidation.
- Williams %R: The Williams %R is hovering near oversold levels, suggesting a possible buying opportunity.
Volatility Analysis:
- Bollinger Bands (BB): The stock price has been trading within the Bollinger Bands, with the bands narrowing, indicating decreasing volatility.
- Bollinger %B: The %B indicator has been fluctuating within a tight range, reflecting a period of consolidation.
Volume Analysis:
- On-Balance Volume (OBV): The OBV has been relatively flat, indicating a balance between buying and selling pressure.
- Chaikin Money Flow (CMF): The CMF has been positive but declining, suggesting weakening buying pressure.
Key Observations:
- The trend indicators suggest a potential bullish reversal, supported by the increasing MACD Histogram.
- Momentum indicators show mixed signals, with RSI indicating neutrality, Stochastic Oscillator hinting at a possible reversal, and Williams %R signaling a buying opportunity.
- Volatility indicators point towards decreasing volatility and a period of consolidation.
- Volume indicators reflect a balance between buying and selling pressure, with a slight decline in buying momentum.
Conclusion:
Based on the analysis of the technical indicators, the stock price of GHMS is likely to experience sideways movement or consolidation in the next few days. While there are indications of a potential bullish reversal in the trend indicators, the mixed signals from momentum indicators and the lack of significant buying pressure in volume indicators suggest a period of indecision in the market. Traders may consider adopting a cautious approach and closely monitor key levels for potential breakout opportunities.