Technical Analysis of GEMD 2024-05-10
Overview:
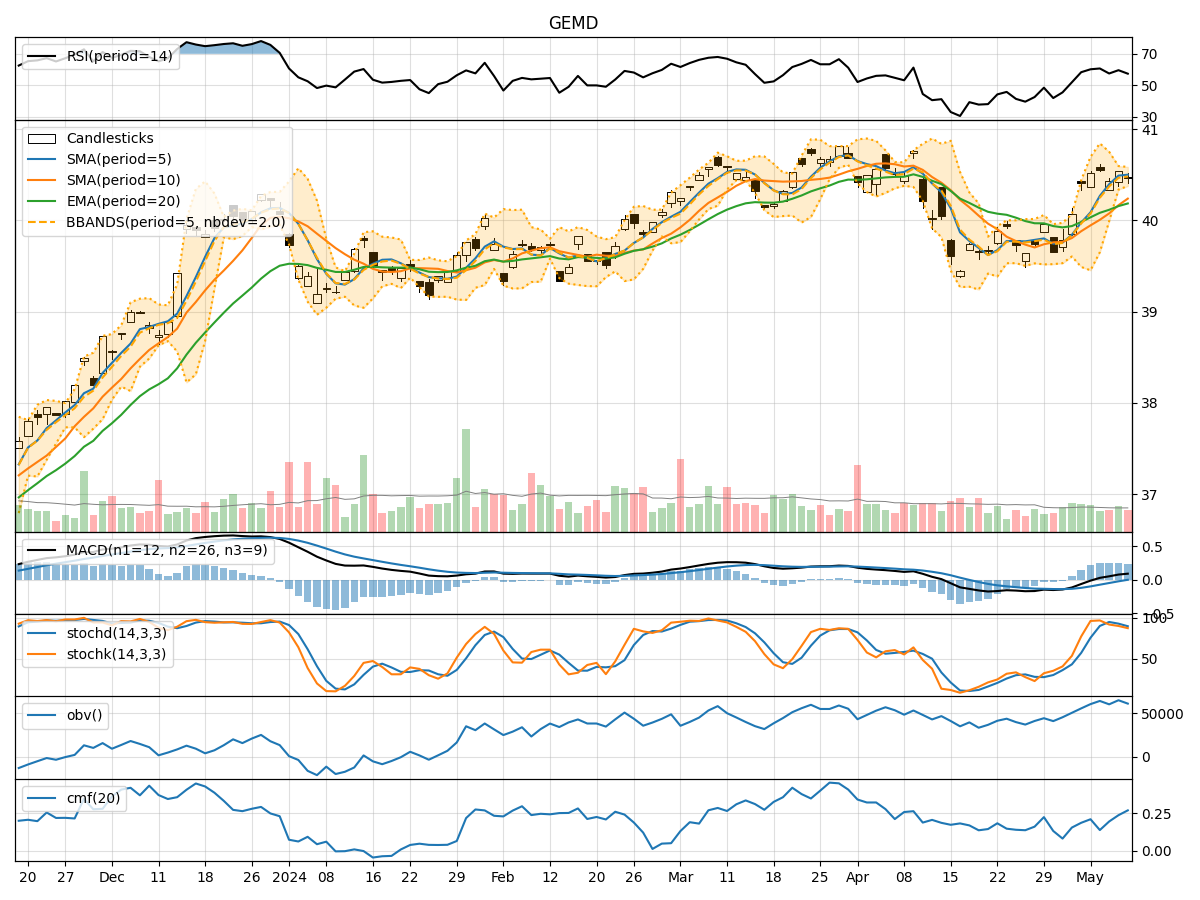
In analyzing the technical indicators for GEMD over the last 5 days, we will delve into the trend, momentum, volatility, and volume indicators to provide a comprehensive outlook on the possible stock price movement in the coming days.
Trend Indicators:
- Moving Averages (MA): The 5-day MA has been consistently above the closing price, indicating a short-term uptrend. Both the SMA(10) and EMA(20) have shown an upward trajectory, supporting a bullish sentiment.
- MACD: The MACD line has been consistently above the signal line, with both lines trending upwards. The positive MACD histogram suggests increasing bullish momentum.
Momentum Indicators:
- RSI: The RSI has been fluctuating around the 50 level, indicating a neutral stance in momentum.
- Stochastic Oscillator: Both %K and %D have been gradually decreasing but remain in the overbought territory, suggesting a potential reversal or consolidation phase.
- Williams %R: The indicator has been hovering in the oversold region, signaling a potential buying opportunity.
Volatility Indicators:
- Bollinger Bands (BB): The stock price has been trading within the bands, with the upper and lower bands converging. This suggests a period of consolidation and potential breakout in either direction.
- Bollinger %B: The %B indicator is approaching the lower band, indicating a possible oversold condition.
Volume Indicators:
- On-Balance Volume (OBV): The OBV has shown mixed movements, indicating indecision among market participants.
- Chaikin Money Flow (CMF): The CMF has been gradually increasing, suggesting a flow of money into the stock.
Key Observations and Opinions:
- Trend: The trend indicators point towards a bullish sentiment, supported by the moving averages and MACD.
- Momentum: The momentum indicators show a mixed picture, with RSI neutral, Stochastic indicating a potential reversal, and Williams %R signaling a buying opportunity.
- Volatility: The volatility indicators suggest a period of consolidation, with the Bollinger Bands narrowing and %B nearing oversold levels.
- Volume: The volume indicators reflect indecision in the market, with OBV showing mixed movements and CMF indicating a slight increase in buying pressure.
Conclusion:
Based on the analysis of the technical indicators, the stock of GEMD is likely to experience sideways consolidation in the coming days. While the trend indicators support a bullish view, the mixed momentum signals and the narrowing Bollinger Bands suggest a period of indecision and potential range-bound trading. Traders should exercise caution and wait for clearer signals before taking significant positions.