Technical Analysis of GDXU 2024-05-03
Overview:
In analyzing the technical indicators for GDXU over the last 5 days, we will delve into the trend, momentum, volatility, and volume indicators to provide a comprehensive outlook on the possible stock price movement in the coming days. By examining these key aspects, we aim to offer valuable insights and recommendations for potential investors.
Trend Analysis:
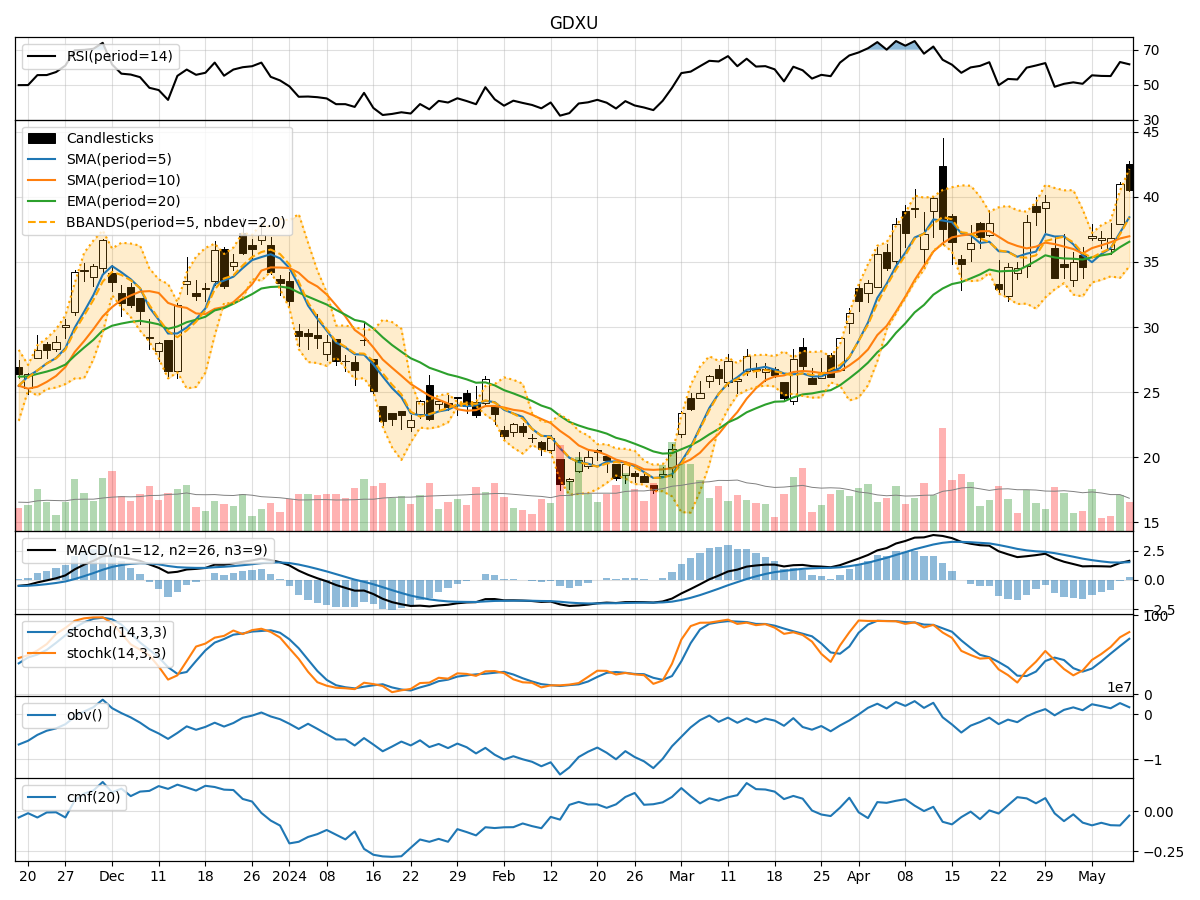
- Moving Averages (MA): The 5-day Moving Average (MA) has been fluctuating around the Simple Moving Average (SMA) and Exponential Moving Average (EMA) values, indicating a lack of clear trend direction.
- MACD: The MACD line has been decreasing, moving towards the signal line, suggesting a potential bearish momentum in the short term.
- MACD Histogram: The MACD Histogram has been consistently negative, indicating a bearish trend momentum.
Momentum Analysis:
- RSI: The Relative Strength Index (RSI) has been hovering around the 50 level, indicating a neutral momentum with no clear overbought or oversold conditions.
- Stochastic Oscillator: Both %K and %D values of the Stochastic Oscillator have been in the lower range, suggesting a bearish momentum.
- Williams %R: The Williams %R indicator has been in the oversold territory, indicating a potential reversal or bounce in the stock price.
Volatility Analysis:
- Bollinger Bands: The Bollinger Bands have been narrowing, indicating decreasing volatility in the stock price.
- Bollinger %B: The %B value has been fluctuating around 0.5, suggesting a neutral stance in terms of volatility.
Volume Analysis:
- On-Balance Volume (OBV): The OBV indicator has been fluctuating, indicating no clear accumulation or distribution pattern.
- Chaikin Money Flow (CMF): The CMF has been negative, suggesting a bearish money flow in the stock.
Key Observations and Opinions:
- Trend: The trend indicators show a lack of clear direction, with a potential bearish bias indicated by the MACD and MACD Histogram.
- Momentum: The momentum indicators suggest a bearish sentiment, especially with the Stochastic Oscillator in the oversold territory.
- Volatility: Volatility has been decreasing, indicating a possible period of consolidation or sideways movement.
- Volume: The volume indicators do not show a strong trend, with the OBV and CMF reflecting a bearish sentiment.
Conclusion:
Based on the analysis of the technical indicators, the next few days for GDXU are likely to see further downward movement in the stock price. The bearish trend and momentum signals, coupled with decreasing volatility and bearish volume patterns, suggest a potential continuation of the current downward trend. Investors should exercise caution and consider waiting for more positive signals before considering any long positions in GDXU.