Technical Analysis of FYT 2024-05-31
Overview:
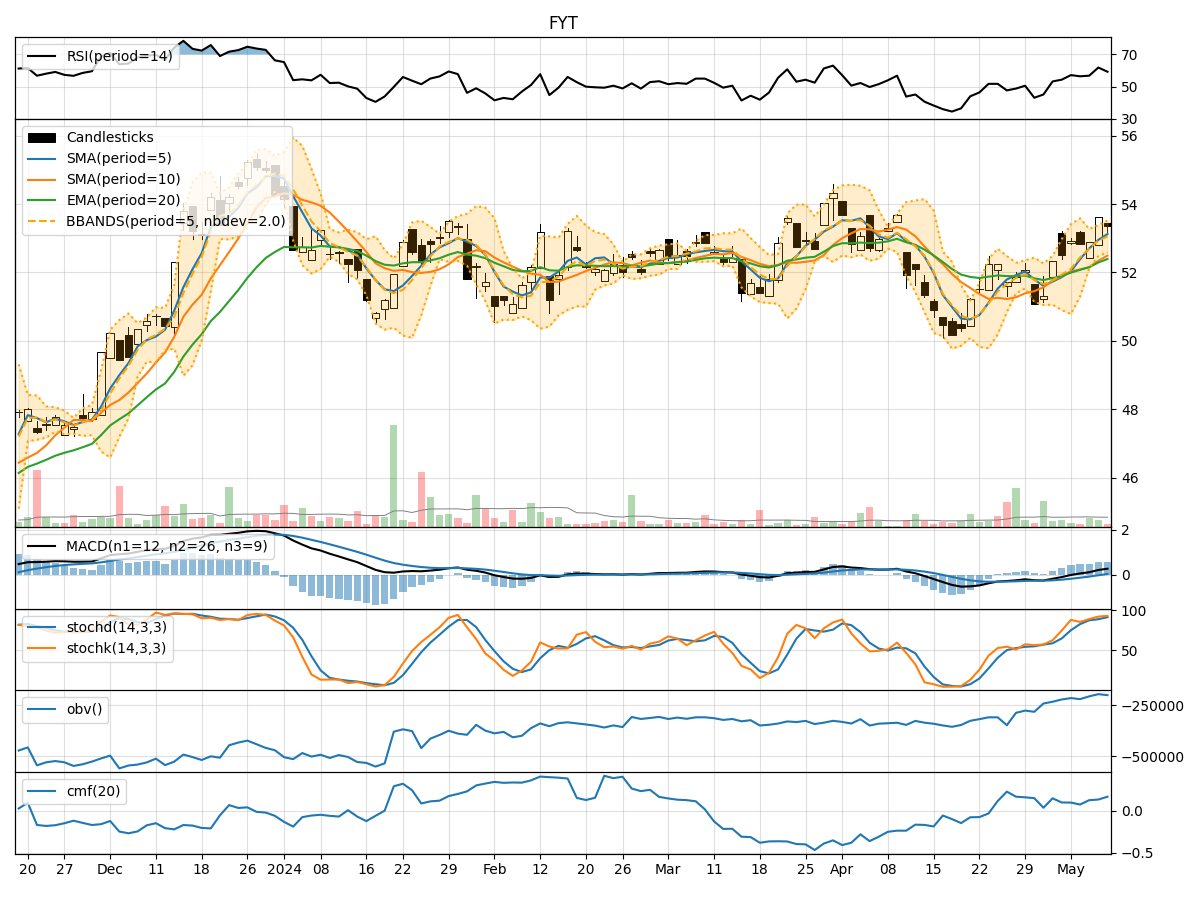
In analyzing the technical indicators for FYT stock over the last 5 days, we will delve into the trends, momentum, volatility, and volume aspects to provide a comprehensive outlook on the possible stock price movement in the upcoming days.
Trend Analysis:
- Moving Averages (MA): The 5-day Moving Average (MA) has been declining gradually, indicating a short-term bearish trend.
- MACD: The MACD line has been consistently below the signal line, suggesting a bearish momentum in the stock.
- EMA: The Exponential Moving Average (EMA) has also been trending downwards, aligning with the bearish sentiment in the short term.
Momentum Analysis:
- RSI: The Relative Strength Index (RSI) has been fluctuating but is currently in the neutral zone, indicating a lack of strong momentum in either direction.
- Stochastic Oscillator: Both %K and %D have been relatively low, signaling a potential oversold condition in the stock.
- Williams %R: The Williams %R is in the oversold territory, suggesting a possible reversal or consolidation phase.
Volatility Analysis:
- Bollinger Bands: The Bollinger Bands have been narrowing, indicating decreasing volatility in the stock price.
- Bollinger %B: The %B indicator is hovering around the middle range, reflecting a neutral stance in terms of volatility.
Volume Analysis:
- On-Balance Volume (OBV): The OBV has shown mixed movements, indicating indecision among market participants regarding the stock.
- Chaikin Money Flow (CMF): The CMF has been positive but relatively low, suggesting a moderate inflow of money into the stock.
Key Observations:
- The stock is currently in a short-term bearish trend based on moving averages and MACD.
- Momentum indicators suggest a lack of strong buying or selling pressure.
- Volatility is decreasing, indicating a potential period of consolidation.
- Volume indicators show mixed signals, reflecting uncertainty among investors.
Conclusion:
Based on the analysis of the technical indicators, the stock is likely to experience further downside movement in the near term. The bearish trend indicated by moving averages and MACD, coupled with the oversold conditions highlighted by momentum indicators, suggest a potential continuation of the current downward trajectory. Additionally, the decreasing volatility and mixed volume signals point towards a period of consolidation or further downside pressure. Investors should exercise caution and consider waiting for more definitive signals before making any significant trading decisions.