Technical Analysis of FXU 2024-05-31
Overview:
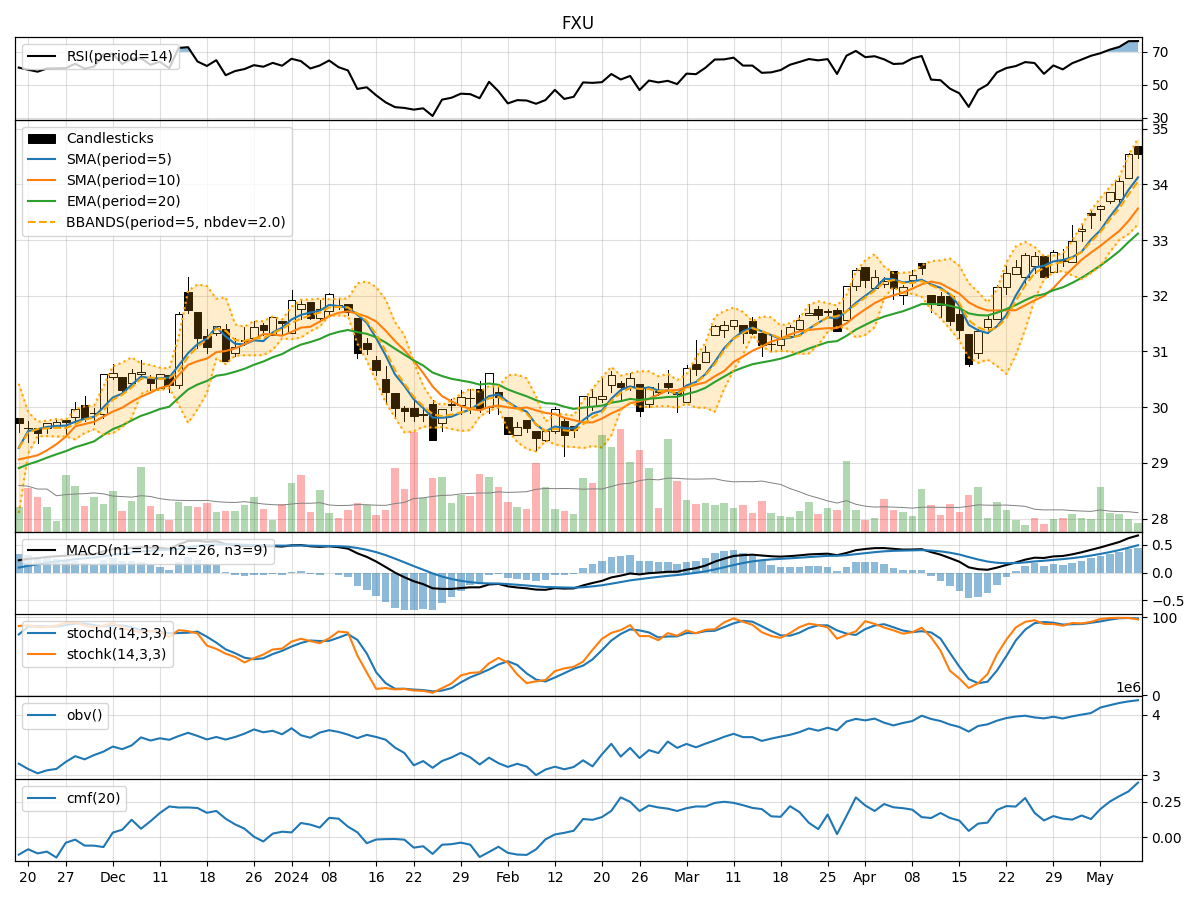
In analyzing the technical indicators for FXU over the last 5 days, we will delve into the trend, momentum, volatility, and volume indicators to provide a comprehensive outlook on the possible stock price movement in the coming days.
Trend Analysis:
- Moving Averages (MA): The 5-day MA has been fluctuating around the closing prices, indicating short-term price trends. The SMA(10) and EMA(20) have shown slight variations but have not diverged significantly.
- MACD: The MACD line has been positive, indicating a bullish trend, although the MACD Histogram has shown a slight decrease over the period.
Momentum Analysis:
- RSI: The RSI has been fluctuating around the mid-level, suggesting a balanced momentum in the stock.
- Stochastic Oscillator: Both %K and %D have been moving within the oversold and neutral zones, indicating a lack of strong momentum.
- Williams %R: The Williams %R has shown fluctuations but has not reached extreme levels, suggesting a neutral momentum.
Volatility Analysis:
- Bollinger Bands (BB): The stock price has been trading within the Bollinger Bands, with the bands narrowing slightly, indicating decreasing volatility.
- Bollinger %B: The %B indicator has been hovering around the mid-level, reflecting a balanced volatility level.
Volume Analysis:
- On-Balance Volume (OBV): The OBV has shown mixed movements, indicating indecision among market participants regarding the stock.
- Chaikin Money Flow (CMF): The CMF has been negative, suggesting outflow of money from the stock over the period.
Key Observations:
- The stock has been trading within a narrow range, with no clear trend direction indicated by the moving averages.
- Momentum indicators suggest a lack of strong buying or selling pressure in the stock.
- Volatility has been decreasing, indicating a potential period of consolidation.
- Volume indicators show mixed signals, with no clear accumulation or distribution pattern.
Conclusion:
Based on the analysis of the technical indicators, the stock is likely to experience a period of consolidation in the coming days. The lack of strong trends in the moving averages, neutral momentum signals, decreasing volatility, and mixed volume patterns all point towards a sideways movement in the stock price. Investors should exercise caution and wait for clearer signals before making significant trading decisions.