Technical Analysis of FXL 2024-05-10
Overview:
In analyzing the technical indicators for FXL over the last 5 days, we will delve into the trend, momentum, volatility, and volume indicators to provide a comprehensive outlook on the possible stock price movement in the coming days. By examining these key aspects, we aim to offer valuable insights and predictions for potential investors.
Trend Analysis:
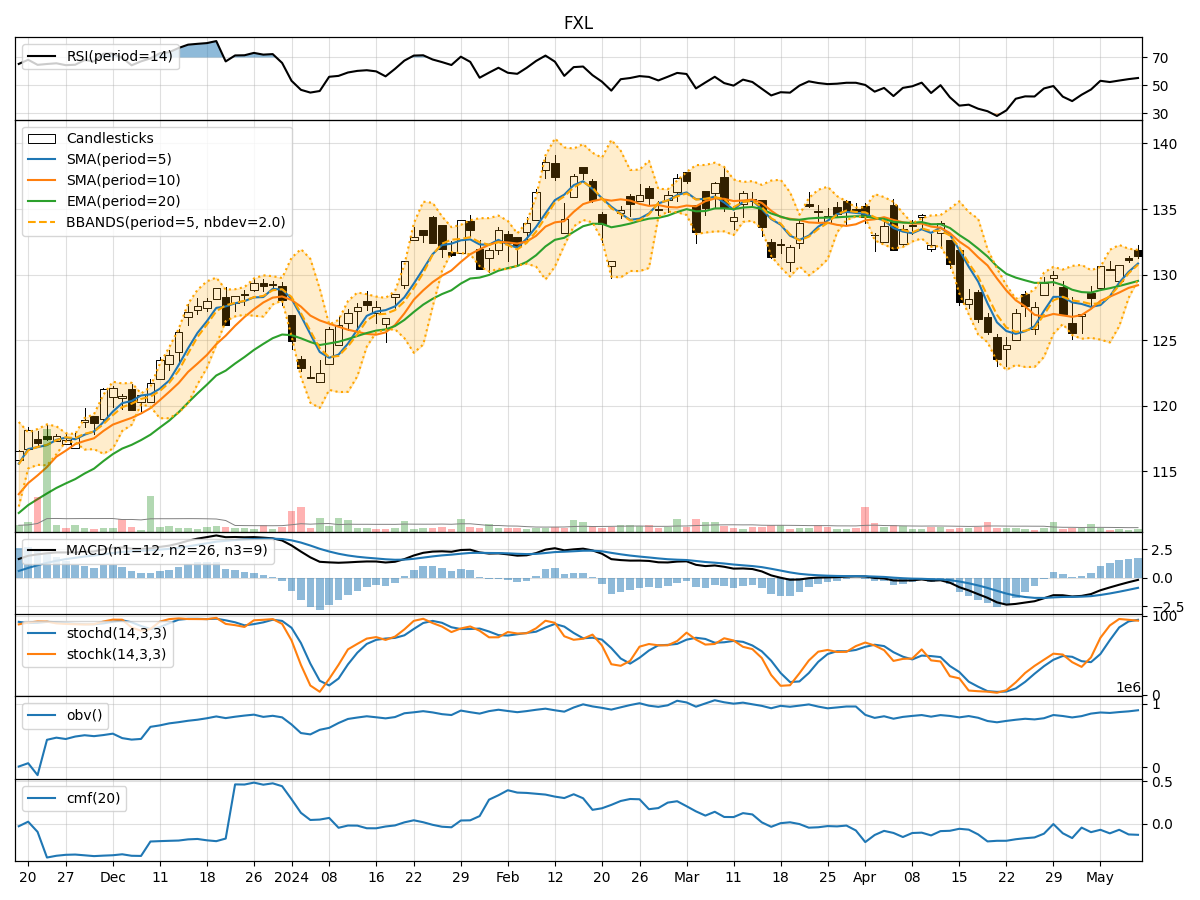
- Moving Averages (MA): The 5-day MA has been consistently above the 10-day SMA, indicating a short-term bullish trend. The EMA(20) has shown an upward trajectory, suggesting a positive momentum in the stock price.
- MACD: The MACD line has been above the signal line for the past 5 days, indicating a bullish trend. The MACD histogram has also been increasing, reflecting strengthening bullish momentum.
Momentum Analysis:
- RSI: The RSI has been gradually increasing and is currently in the mid-range, indicating a balanced momentum without being overbought or oversold.
- Stochastic Oscillator: Both %K and %D lines of the Stochastic Oscillator have been in the overbought territory, suggesting a potential reversal or consolidation in the near future.
Volatility Analysis:
- Bollinger Bands (BB): The stock price has been trading within the upper Bollinger Band, indicating an overbought condition. The bands are narrowing, suggesting a potential decrease in volatility.
- Bollinger %B (BBP): The %B indicator is currently above 0.8, indicating a high price relative to the upper band and a possible reversal or pullback.
Volume Analysis:
- On-Balance Volume (OBV): The OBV has shown mixed signals with fluctuations in volume, indicating indecision among market participants.
- Chaikin Money Flow (CMF): The CMF has been negative over the past 5 days, suggesting selling pressure in the stock.
Conclusion:
Based on the technical indicators analyzed: - Trend: The stock is in an upward trend supported by moving averages and MACD. - Momentum: The momentum is neutral to slightly bearish as indicated by the RSI and Stochastic Oscillator. - Volatility: The stock is currently in an overbought condition based on Bollinger Bands and %B indicator. - Volume: The volume indicators show indecisiveness among investors.
Possible Stock Price Movement:
Considering the overall analysis, the stock price of FXL is likely to experience a short-term consolidation or pullback in the coming days. Traders should be cautious of the overbought conditions and monitor for potential reversal signals. Long-term investors may consider waiting for a better entry point or maintaining their positions with a risk management strategy in place.