Technical Analysis of FXED 2024-05-10
Overview:
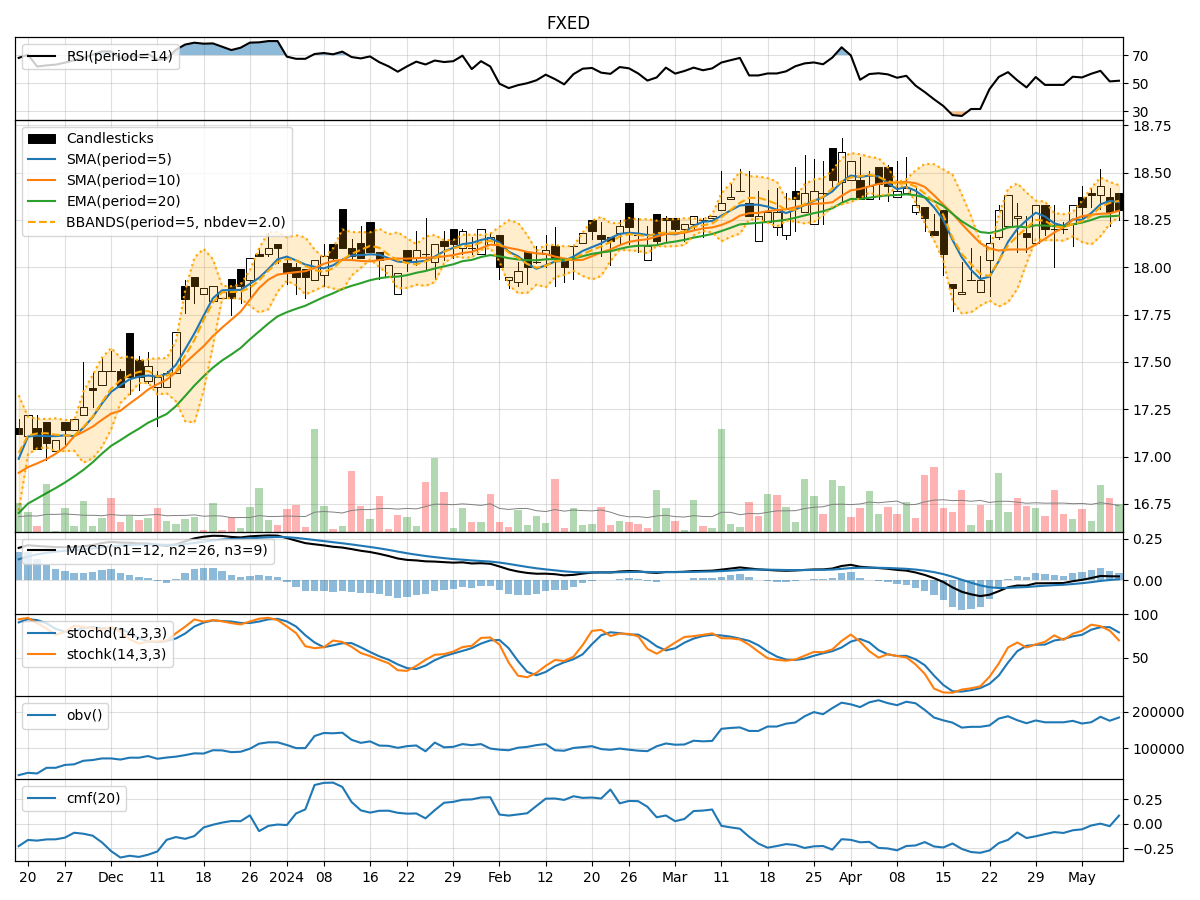
In analyzing the technical indicators for the stock FXED over the last 5 days, we will delve into the trends, momentum, volatility, and volume aspects to provide a comprehensive outlook on the possible stock price movement in the coming days. By examining key indicators such as moving averages, MACD, RSI, Bollinger Bands, and OBV, we aim to offer valuable insights and predictions for potential price action.
Trend Analysis:
- Moving Averages (MA): The 5-day MA has been trending slightly above the Simple Moving Average (SMA) and Exponential Moving Average (EMA), indicating a short-term bullish trend.
- MACD: The MACD line has been consistently positive, with the MACD histogram showing an increasing trend, suggesting bullish momentum.
- Conclusion: The trend indicators point towards an upward movement in the stock price.
Momentum Analysis:
- RSI: The Relative Strength Index (RSI) has been fluctuating around the mid-level, indicating a neutral momentum.
- Stochastic Oscillator: The Stochastic indicators have shown a mix of overbought and oversold conditions, reflecting a lack of clear direction.
- Conclusion: The momentum indicators suggest a sideways movement in the stock price.
Volatility Analysis:
- Bollinger Bands: The Bollinger Bands have shown a narrowing range, indicating decreasing volatility.
- Conclusion: The volatility indicators signal a consolidation phase in the stock price.
Volume Analysis:
- On-Balance Volume (OBV): The OBV has shown mixed movements, with no clear trend in volume accumulation.
- Chaikin Money Flow (CMF): The CMF has been fluctuating around the zero line, indicating indecision in the market.
- Conclusion: The volume indicators suggest a lack of conviction in the stock price movement.
Overall Conclusion:
Based on the analysis of the technical indicators, the stock FXED is likely to experience a sideways movement in the near future. While the trend indicators point towards an upward bias, the momentum indicators suggest a lack of clear direction. The volatility indicators signal a consolidation phase, and the volume indicators indicate a lack of strong conviction from market participants.
Recommendation:
Given the mixed signals from the technical indicators, it is advisable for investors to exercise caution and closely monitor the price action of FXED in the coming days. Consider waiting for more clarity in the market dynamics before making significant trading decisions. It is essential to combine technical analysis with fundamental research to gain a comprehensive understanding of the stock's potential movements.