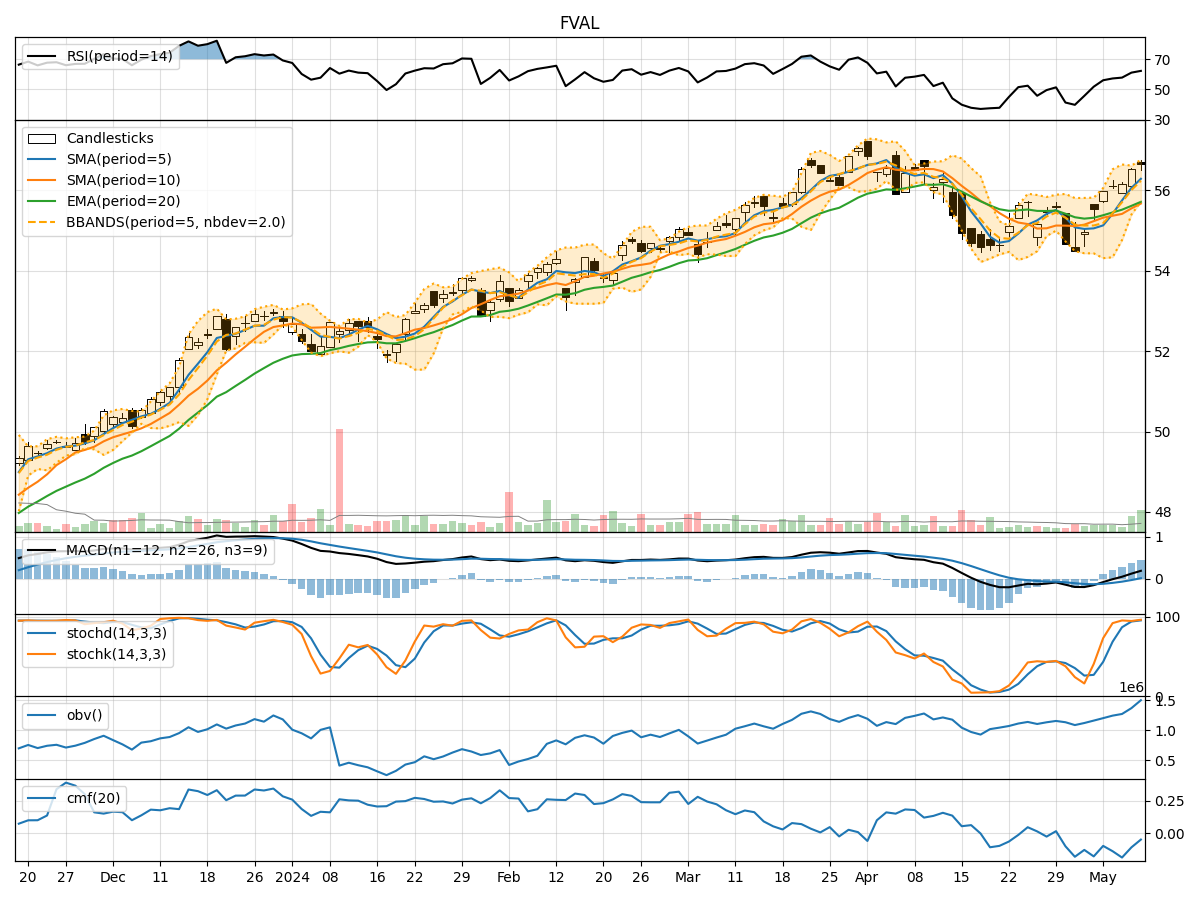
Technical Analysis of FVAL 2024-05-10
Overview:
In analyzing the technical indicators for the stock represented by the FVAL data over the last 5 days, we will delve into the trends, momentum, volatility, and volume indicators to provide a comprehensive outlook on the possible stock price movement in the coming days.
Trend Indicators:
- Moving Averages (MA): The 5-day Moving Average has been consistently above the closing prices, indicating a bullish trend.
- MACD: The MACD line has been consistently above the signal line, suggesting a bullish momentum.
- EMA: The Exponential Moving Average has been trending upwards, supporting the bullish sentiment.
Momentum Indicators:
- RSI: The Relative Strength Index has been in the overbought territory, indicating a strong bullish momentum.
- Stochastic Oscillator: Both %K and %D have been in the overbought zone, signaling a strong bullish momentum.
- Williams %R: The indicator has been consistently in the oversold region, supporting the bullish outlook.
Volatility Indicators:
- Bollinger Bands: The stock price has been trading within the upper Bollinger Band, suggesting an overbought condition.
- Bollinger %B: The %B indicator has been above 0.8, indicating a potential overbought situation.
Volume Indicators:
- On-Balance Volume (OBV): The OBV has been steadily increasing, reflecting strong buying pressure.
- Chaikin Money Flow (CMF): The CMF has been negative, indicating some selling pressure in the market.
Key Observations and Opinions:
- Trend: The stock is in a strong bullish trend based on moving averages and MACD.
- Momentum: Momentum indicators like RSI and Stochastic Oscillator suggest a strong bullish sentiment.
- Volatility: The Bollinger Bands and %B indicate a potential overbought scenario.
- Volume: The OBV shows consistent buying pressure, while CMF signals some selling pressure.
Conclusion:
Based on the analysis of the technical indicators, the stock is currently in an overbought state with strong bullish momentum. However, the high RSI and Stochastic values, along with the overbought Bollinger Bands, suggest a potential reversal or correction in the near future. Traders should exercise caution and consider taking profits or implementing risk management strategies. The stock may experience a pullback or consolidation before potentially resuming its upward trend.