Technical Analysis of FUSI 2024-05-10
Overview:
In analyzing the technical indicators for FUSI stock over the last 5 days, we will delve into the trend, momentum, volatility, and volume indicators to provide a comprehensive outlook on the possible future stock price movement. By examining these key indicators, we aim to offer valuable insights and recommendations for potential investors.
Trend Indicators:
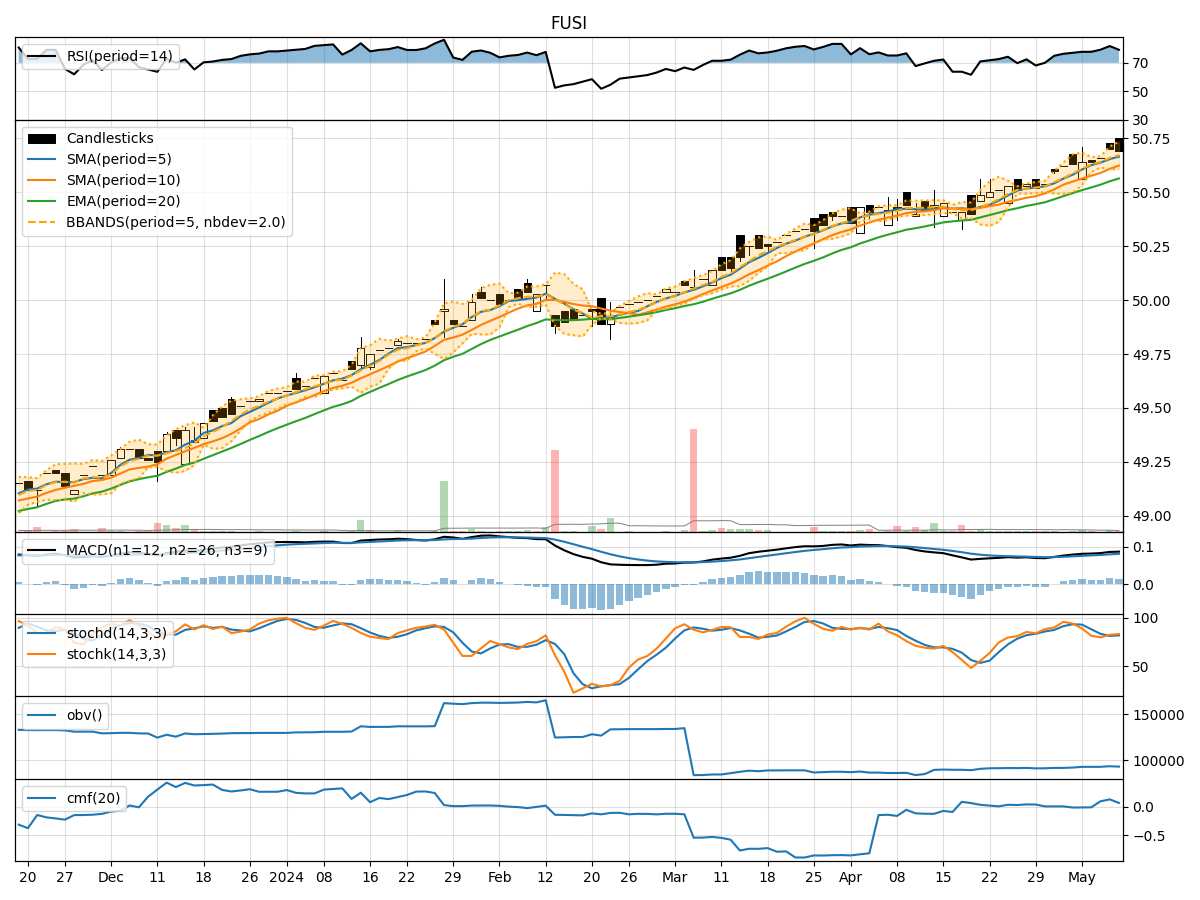
- Moving Averages (MA): The 5-day Moving Average (MA) has been consistently above the Simple Moving Average (SMA) and Exponential Moving Average (EMA), indicating a bullish trend.
- MACD: The MACD line has been above the signal line, with both lines showing an upward trend, suggesting positive momentum.
Momentum Indicators:
- RSI: The Relative Strength Index (RSI) has been fluctuating around 80, indicating overbought conditions but still showing strength in the stock.
- Stochastic Oscillator: Both %K and %D have been in the overbought zone, suggesting a strong bullish momentum.
Volatility Indicators:
- Bollinger Bands (BB): The stock price has been trading within the upper Bollinger Band, indicating high volatility and potential overbought conditions.
Volume Indicators:
- On-Balance Volume (OBV): The OBV has shown mixed signals, with some days experiencing selling pressure and others showing accumulation.
- Chaikin Money Flow (CMF): The CMF has been positive, indicating buying pressure in the stock.
Key Observations:
- The trend indicators suggest a strong bullish sentiment, supported by the moving averages and MACD.
- Momentum indicators indicate overbought conditions but still show strength in the stock's upward momentum.
- Volatility indicators point to high volatility and potential overbought conditions, as seen in the Bollinger Bands.
- Volume indicators show mixed signals, with OBV reflecting some selling pressure but CMF indicating buying pressure.
Conclusion:
Based on the analysis of the technical indicators, the stock is likely to continue its upward movement in the next few days. The strong bullish trend, positive momentum, and high volatility suggest that the stock may experience further price appreciation. Investors should consider capitalizing on this bullish momentum and potential price growth in the coming days.