Technical Analysis of FTBD 2024-05-10
Overview:
In analyzing the technical indicators for FTBD over the last 5 days, we will delve into the trend, momentum, volatility, and volume indicators to provide a comprehensive outlook on the possible stock price movement in the coming days. By examining these key aspects, we aim to offer valuable insights and predictions to guide your investment decisions.
Trend Indicators:
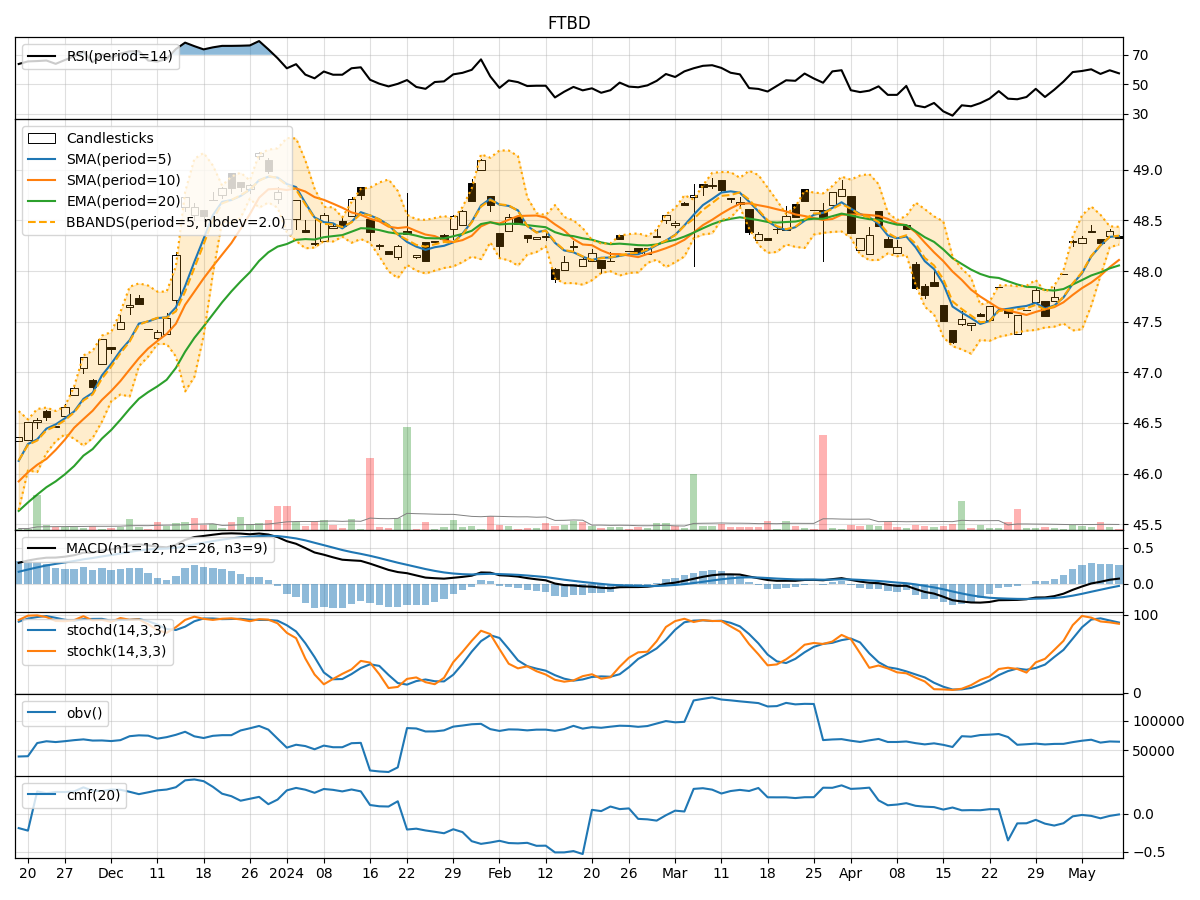
- Moving Averages (MA): The 5-day Moving Average (MA) has been consistently above the Simple Moving Average (SMA) and Exponential Moving Average (EMA), indicating a bullish trend.
- MACD: The Moving Average Convergence Divergence (MACD) has shown positive values, with the MACD line consistently above the Signal line, suggesting bullish momentum.
Momentum Indicators:
- RSI: The Relative Strength Index (RSI) has been fluctuating around the 50 level, indicating a neutral momentum in the stock.
- Stochastic Oscillator: Both %K and %D values have been declining, suggesting a potential reversal in momentum to the downside.
Volatility Indicators:
- Bollinger Bands (BB): The stock price has been trading within the Bollinger Bands, with the bands narrowing, indicating decreasing volatility.
Volume Indicators:
- On-Balance Volume (OBV): The OBV has shown a slight decrease over the last 5 days, indicating some selling pressure.
- Chaikin Money Flow (CMF): The CMF has been negative, suggesting a bearish money flow in the stock.
Key Observations:
- The trend indicators suggest a bullish sentiment in the short term.
- Momentum indicators show a neutral stance with a potential shift to bearish momentum.
- Volatility has been decreasing, indicating a possible period of consolidation.
- Volume indicators point towards a slight selling pressure in the stock.
Conclusion:
Based on the analysis of the technical indicators, the next few days' possible stock price movement for FTBD could be sideways with a slight bearish bias. While the trend indicators signal a bullish outlook, the momentum indicators and volume indicators suggest a potential shift towards bearish momentum and selling pressure. The decreasing volatility also indicates a period of consolidation. Therefore, investors should exercise caution and closely monitor the price action for any signs of a trend reversal or continuation.