Technical Analysis of FTA 2024-05-10
Overview:
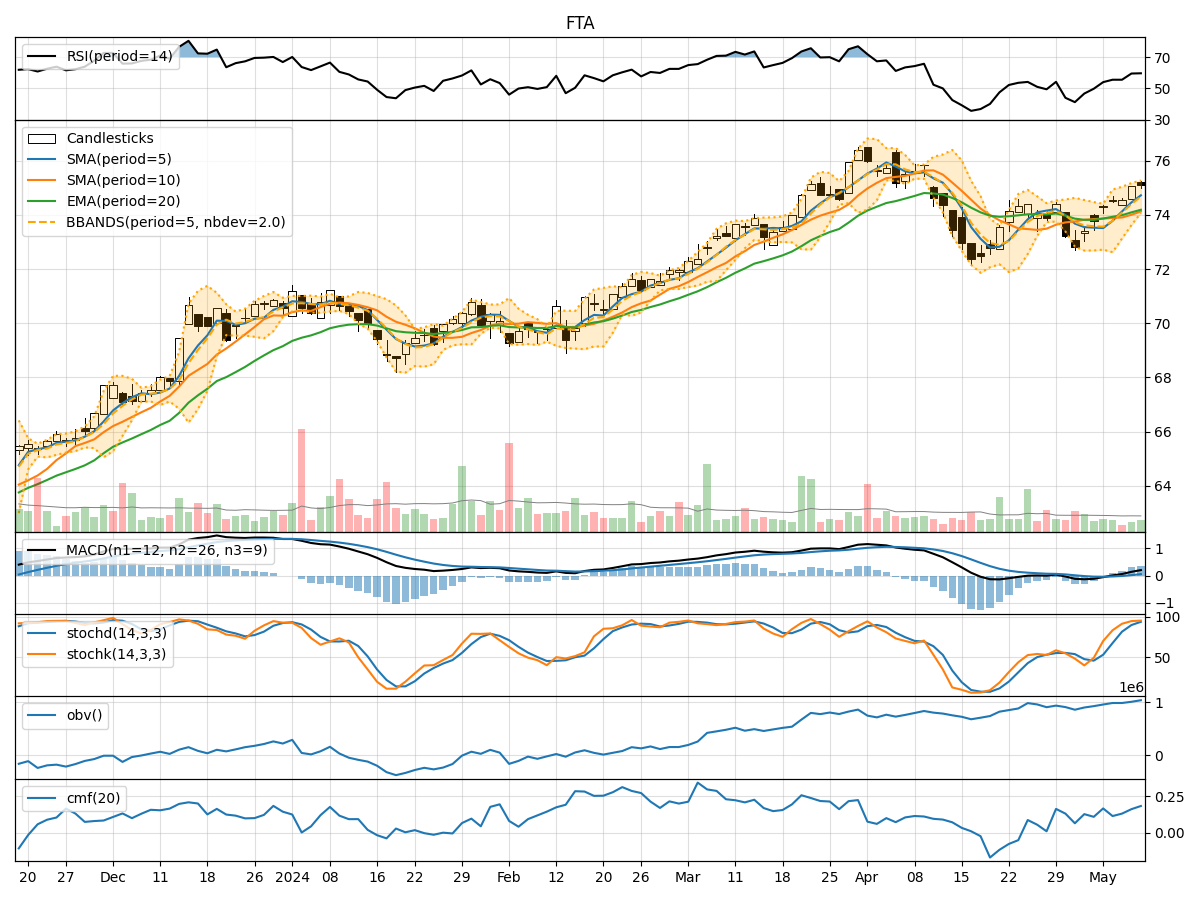
In the last 5 trading days, the stock has shown a consistent uptrend in both price and volume. The moving averages have been trending upwards, indicating a bullish sentiment. Momentum indicators like RSI and Stochastic oscillators are in overbought territory, suggesting a potential pullback. Volatility indicators show a narrowing Bollinger Band, indicating a possible decrease in price volatility. Volume indicators have been positive, supporting the uptrend.
Trend Analysis:
- Moving Averages (MA): The 5-day MA has been consistently above the 10-day SMA, indicating a short-term bullish trend. The EMA(20) has also been trending upwards, supporting the bullish sentiment.
- MACD: The MACD line has been above the signal line for the past 5 days, indicating a bullish trend. The MACD histogram has been increasing, showing strengthening bullish momentum.
Momentum Analysis:
- RSI: The RSI has been in the overbought zone for the last few days, suggesting a potential reversal or pullback in the stock price.
- Stochastic Oscillator: Both %K and %D lines are in the overbought region, indicating a possible upcoming bearish crossover.
Volatility Analysis:
- Bollinger Bands (BB): The Bollinger Bands have been narrowing, indicating decreasing price volatility. This could signal a period of consolidation or a potential breakout in the near future.
Volume Analysis:
- On-Balance Volume (OBV): The OBV has been steadily increasing over the last 5 days, confirming the uptrend in the stock price. This suggests that the buying pressure has been strong.
- Chaikin Money Flow (CMF): The CMF(20) has been positive, indicating that money is flowing into the stock. This supports the bullish outlook.
Conclusion:
Based on the technical indicators and analysis: - Trend: The stock is in a strong upward trend, supported by moving averages and MACD. - Momentum: The overbought RSI and Stochastic indicators suggest a potential pullback or consolidation in the stock price. - Volatility: The narrowing Bollinger Bands indicate decreasing volatility, which could lead to a period of consolidation before a potential breakout. - Volume: The increasing OBV and positive CMF indicate strong buying pressure and bullish sentiment.
Overall Assessment:
- Short-Term: The stock may experience a slight pullback or consolidation in the next few days due to overbought momentum indicators.
- Medium-Long Term: The overall trend remains bullish, and any pullback could present a buying opportunity for investors looking to enter or add to their positions.
Recommendation:
- Short-Term Traders: Consider taking profits or waiting for a better entry point during a potential pullback.
- Long-Term Investors: Hold onto positions or consider accumulating more during any dips for the long-term growth potential.
Key Conclusion:
The stock is likely to experience a short-term pullback or consolidation before potentially resuming its bullish trend in the medium to long term.