Technical Analysis of FQAL 2024-05-10
Overview:
In analyzing the technical indicators for FQAL stock over the last 5 days, we will delve into the trend, momentum, volatility, and volume indicators to provide a comprehensive outlook on the possible stock price movement in the coming days. By examining these key indicators, we aim to offer valuable insights and predictions to guide your investment decisions.
Trend Analysis:
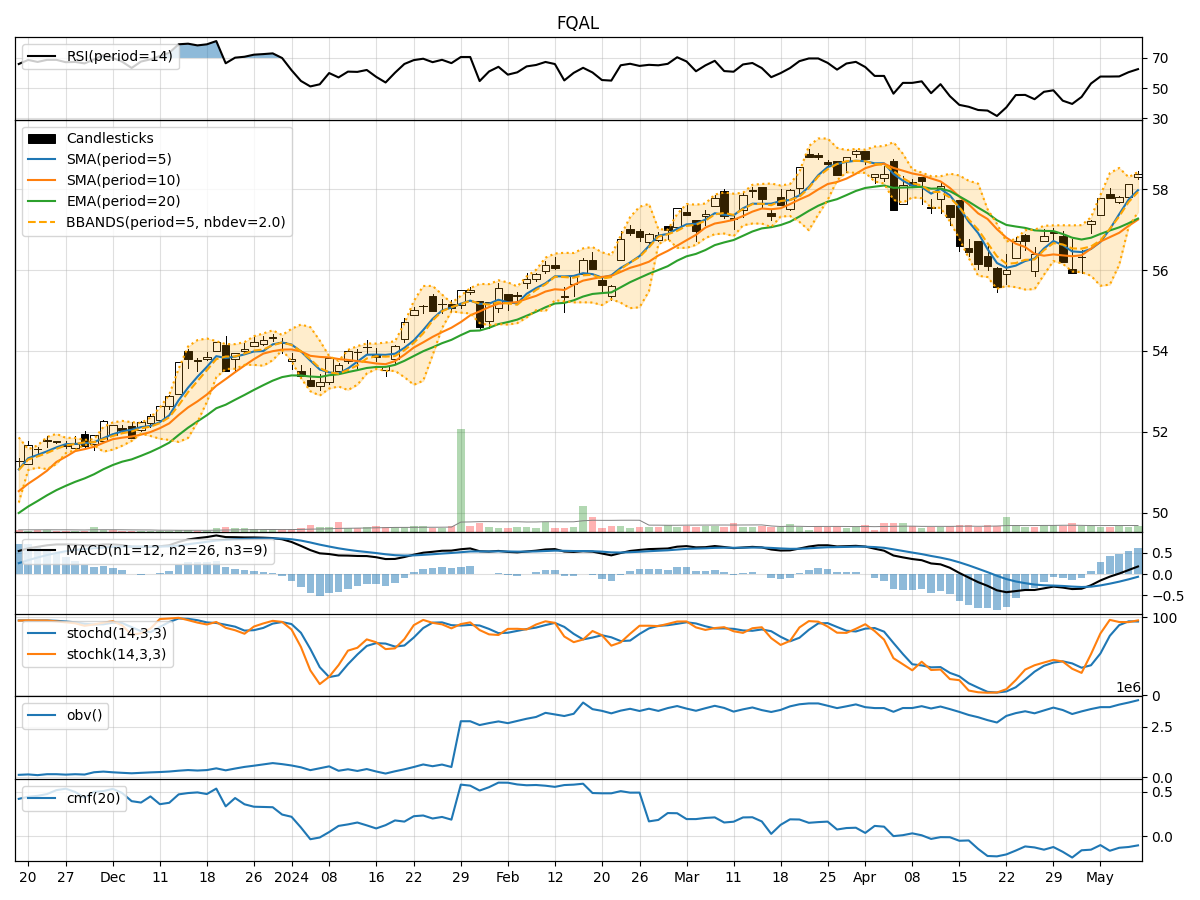
- Moving Averages (MA): The 5-day Moving Average (MA) has been consistently increasing, indicating a bullish trend in the short term.
- MACD: The MACD line has been rising steadily, with the MACD histogram also showing positive values, suggesting bullish momentum.
- EMA: The Exponential Moving Average (EMA) has been trending upwards, supporting the bullish sentiment in the market.
Momentum Analysis:
- RSI: The Relative Strength Index (RSI) has been increasing and is currently in the overbought territory, signaling a strong bullish momentum.
- Stochastic Oscillator: Both %K and %D lines of the Stochastic Oscillator are in the overbought zone, indicating a potential reversal or consolidation.
- Williams %R: The Williams %R is in the oversold region, suggesting a possible pullback in the near term.
Volatility Analysis:
- Bollinger Bands: The Bollinger Bands are narrowing, indicating decreasing volatility and a potential period of consolidation.
- Bollinger %B: The %B indicator is hovering around 1, suggesting that the stock price is at the upper band, potentially signaling an overbought condition.
Volume Analysis:
- On-Balance Volume (OBV): The OBV indicator has been increasing, reflecting positive buying pressure in the stock.
- Chaikin Money Flow (CMF): The CMF is negative, indicating some selling pressure despite the rising OBV.
Conclusion:
Based on the analysis of the technical indicators, the stock is currently in a strong bullish trend with positive momentum and increasing buying pressure. However, the overbought conditions in the RSI and Stochastic Oscillator suggest a potential pullback or consolidation in the near term. The narrowing Bollinger Bands also indicate reduced volatility and a possible period of sideways movement.
Recommendation:
Considering the overall bullish sentiment but the overbought conditions in some indicators, it is advisable to exercise caution and consider potential profit-taking opportunities. Traders may look for entry points during pullbacks, while long-term investors could hold their positions with a close eye on the evolving market dynamics. Monitoring key support and resistance levels will be crucial in navigating the upcoming price movements.