Technical Analysis of FNDX 2024-05-10
Overview:
In analyzing the technical indicators for FNDX over the last 5 days, we will delve into the trend, momentum, volatility, and volume indicators to provide a comprehensive outlook on the possible stock price movement in the coming days. By examining these key indicators, we aim to offer valuable insights and predictions for informed decision-making.
Trend Indicators:
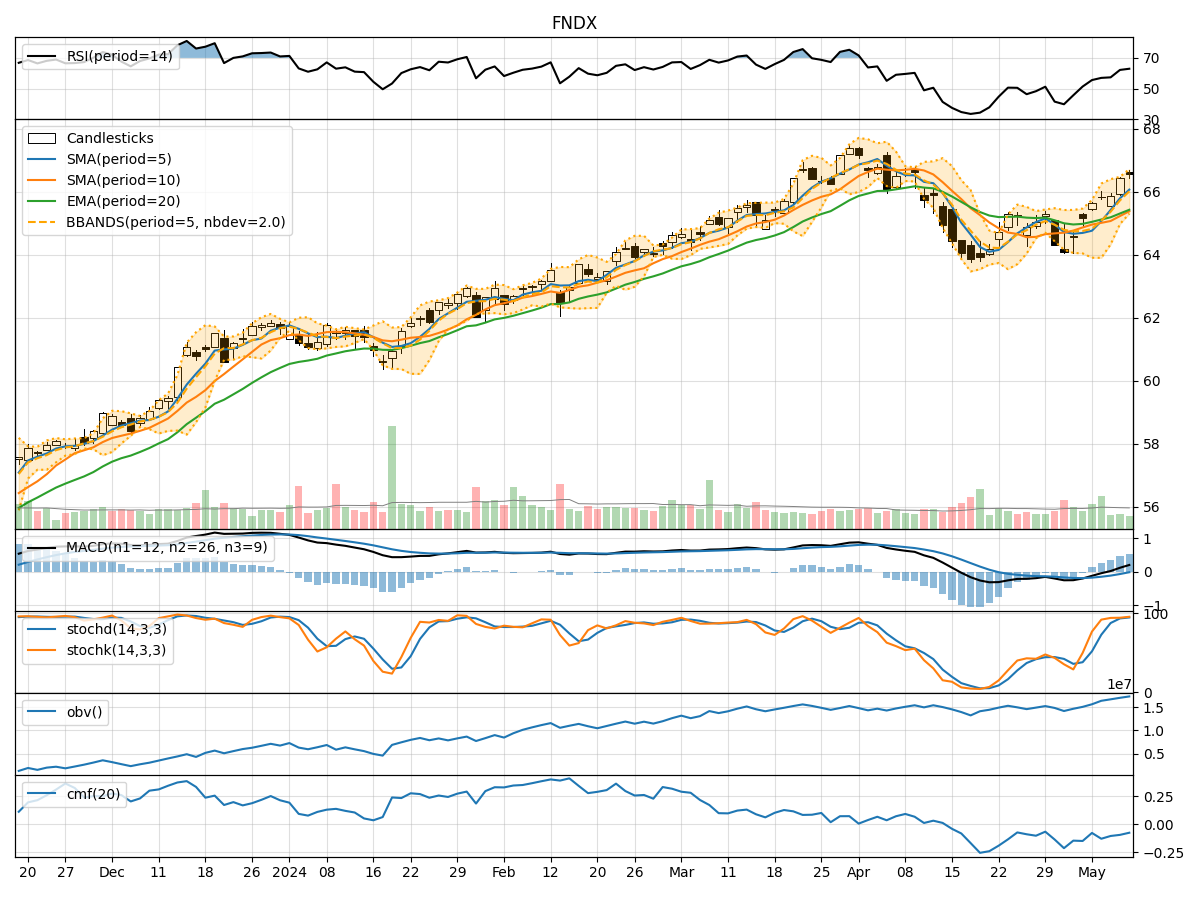
- Moving Averages (MA): The 5-day MA has been consistently above the 10-day SMA, indicating a short-term bullish trend. The EMA(20) has shown a gradual uptrend, suggesting positive momentum in the stock price.
- MACD: The MACD line has been consistently above the signal line, with both lines trending upwards. This signals a bullish momentum in the stock.
- Conclusion: The trend indicators suggest a bullish outlook for FNDX in the near term.
Momentum Indicators:
- RSI: The RSI has been trending upwards and is currently in the overbought territory, indicating strong buying momentum.
- Stochastic Oscillator: Both %K and %D lines are in the overbought zone, suggesting a potential reversal or consolidation.
- Williams %R: The indicator is in the oversold region, indicating a potential buying opportunity.
- Conclusion: Momentum indicators show a mixed signal, with RSI indicating bullish momentum while Stochastic and Williams %R suggest a possible reversal or consolidation.
Volatility Indicators:
- Bollinger Bands: The stock price has been trading within the upper Bollinger Band, indicating an overbought condition. However, the bands have not shown significant expansion, suggesting stable volatility.
- Conclusion: Volatility indicators point towards a sideways movement with a slight tendency towards a bearish bias due to the overbought condition.
Volume Indicators:
- On-Balance Volume (OBV): The OBV has shown a slight increase over the last 5 days, indicating some accumulation by investors.
- Chaikin Money Flow (CMF): The CMF has been negative, suggesting a slight outflow of money from the stock.
- Conclusion: Volume indicators reflect a neutral sentiment with a slight inclination towards bearish due to the negative CMF.
Overall Conclusion:
Based on the analysis of trend, momentum, volatility, and volume indicators, the next few days for FNDX are likely to see a consolidation phase with a slight bearish bias. While trend indicators signal a bullish outlook, momentum indicators show a mixed sentiment with a potential for reversal or consolidation. Volatility indicators suggest stable but slightly bearish conditions, and volume indicators indicate a neutral to bearish sentiment. Therefore, investors should exercise caution and consider potential profit-taking opportunities or wait for clearer signals before making significant trading decisions.