Technical Analysis of FLQL 2024-05-10
Overview:
In analyzing the technical indicators for FLQL over the last 5 days, we will delve into the trend, momentum, volatility, and volume indicators to provide a comprehensive outlook on the possible stock price movement in the coming days. By examining these key aspects, we aim to offer valuable insights and predictions to guide your investment decisions.
Trend Indicators:
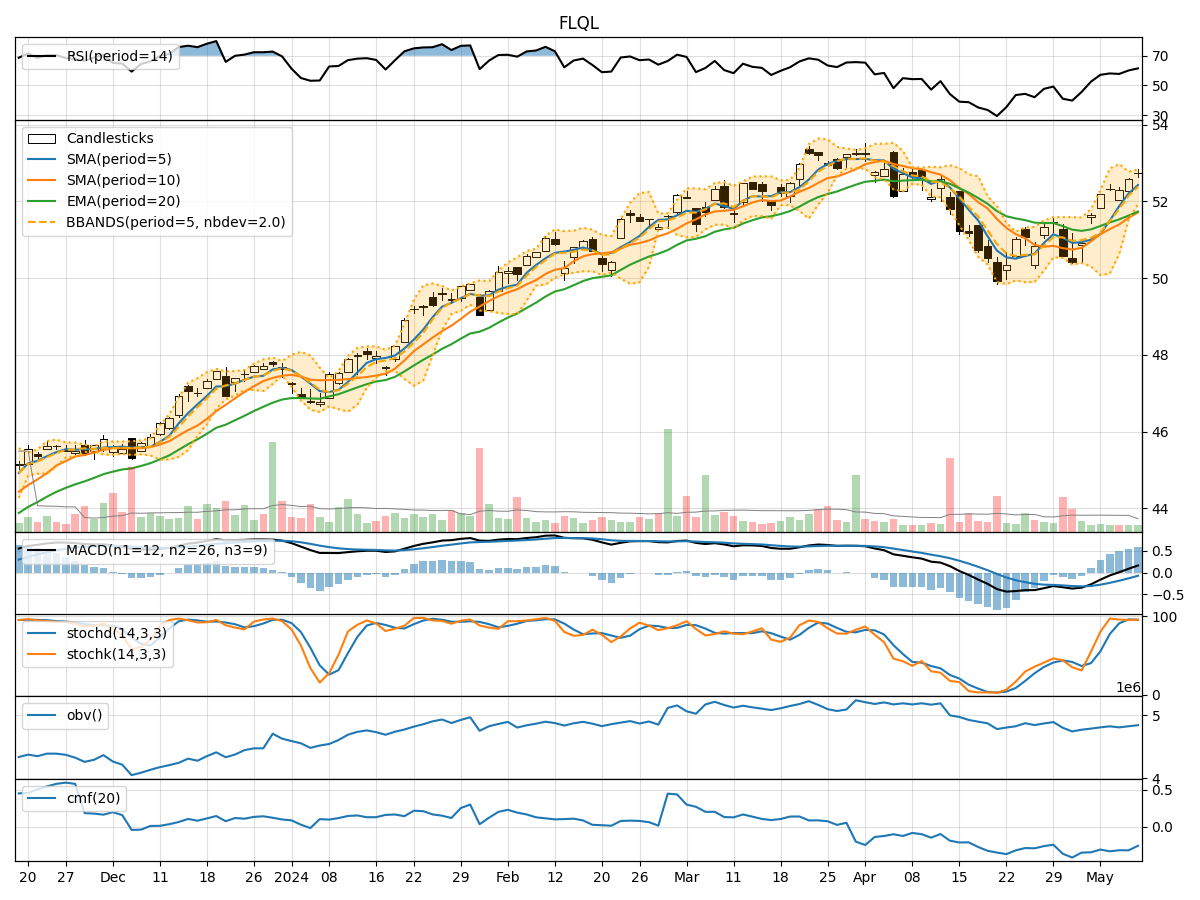
- Moving Averages (MA): The 5-day MA has been consistently above the 10-day SMA, indicating a short-term bullish trend.
- MACD: The MACD line has been trending upwards, with the MACD histogram showing positive values, suggesting increasing bullish momentum.
- EMA: The EMA has been on an upward trajectory, supporting the bullish sentiment in the short to medium term.
Momentum Indicators:
- RSI: The RSI has been in the overbought territory, indicating a strong bullish momentum.
- Stochastic Oscillator: Both %K and %D have been in the overbought zone, signaling a potential reversal or consolidation.
- Williams %R: The indicator has been in the oversold region, suggesting a possible reversal in the short term.
Volatility Indicators:
- Bollinger Bands (BB): The bands have been widening, indicating increased volatility in the stock price.
- BB %B: The %B indicator has been fluctuating within a range, suggesting potential price reversals or breakouts.
- BB Width: The widening of the bands indicates a potential increase in volatility and price movements.
Volume Indicators:
- On-Balance Volume (OBV): The OBV has shown mixed signals, with some days experiencing selling pressure and others showing accumulation.
- Chaikin Money Flow (CMF): The CMF has been negative, indicating distribution rather than accumulation.
Key Observations and Opinions:
- Trend: The trend indicators suggest a bullish bias in the short to medium term.
- Momentum: The momentum indicators point towards a strong bullish sentiment, but the overbought conditions may lead to a potential reversal or consolidation.
- Volatility: Increasing volatility as indicated by the Bollinger Bands may lead to sharp price movements.
- Volume: Mixed signals from volume indicators suggest uncertainty in market participation.
Conclusion:
Based on the analysis of the technical indicators, the stock FLQL is currently in a strong bullish trend with positive momentum. However, the overbought conditions and mixed volume signals indicate a potential consolidation or reversal in the near future. Traders should closely monitor key support and resistance levels for potential entry or exit points. Exercise caution in the coming days as the stock may experience increased volatility.