Technical Analysis of FLGV 2024-05-10
Overview:
In analyzing the technical indicators for FLGV over the last 5 days, we will delve into the trend, momentum, volatility, and volume indicators to provide a comprehensive outlook on the possible stock price movement in the coming days. By examining these key aspects, we aim to offer valuable insights and predictions for potential investors.
Trend Analysis:
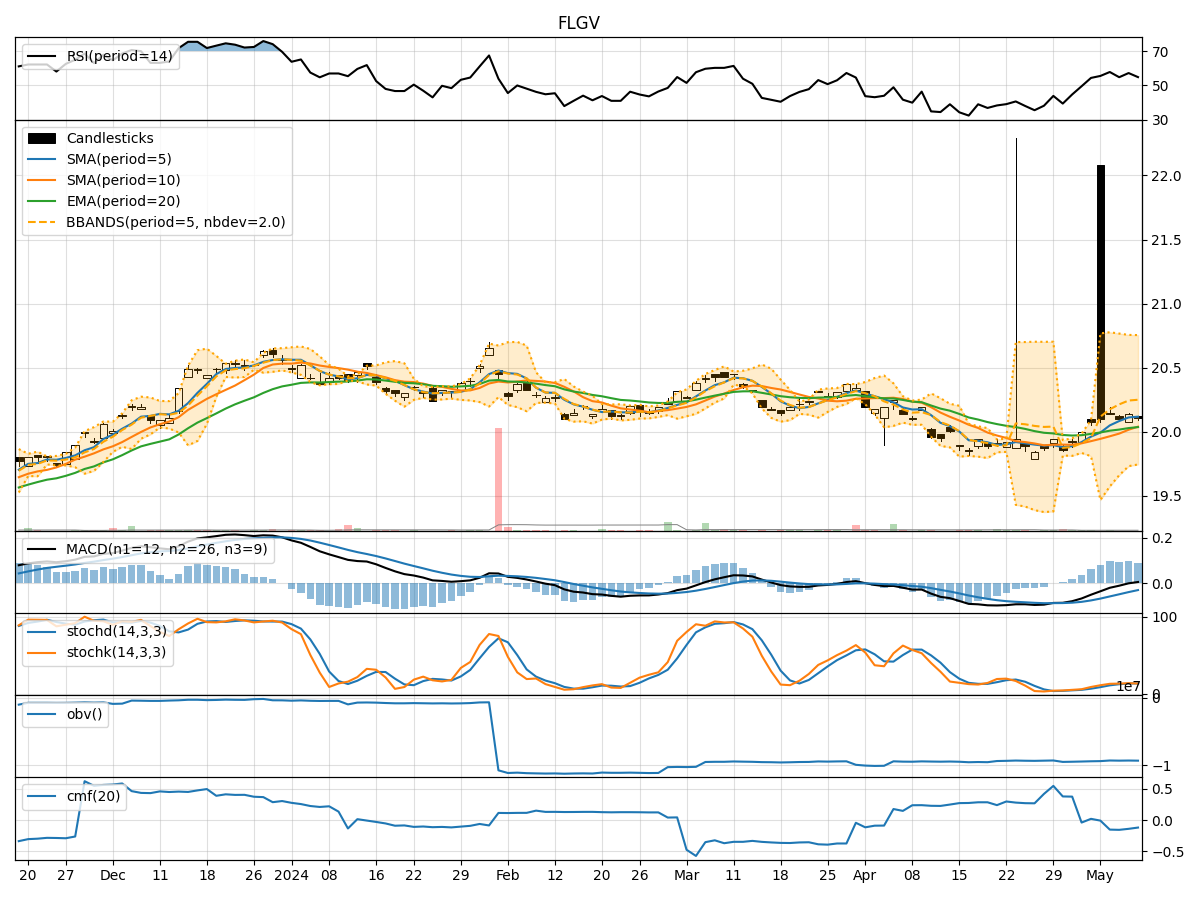
- Moving Averages (MA): The 5-day Moving Average (MA) has been showing a slight upward trend, indicating a positive momentum in the short term.
- MACD and Signal Line: The MACD line has been consistently above the Signal line, suggesting a bullish momentum in the stock.
- Relative Strength Index (RSI): The RSI has been fluctuating around the neutral zone, indicating a balanced buying and selling pressure.
Momentum Analysis:
- Stochastic Oscillator: The Stochastic Oscillator has been hovering in the overbought territory, suggesting a potential reversal or consolidation phase.
- Williams %R (WillR): The Williams %R indicator has been indicating oversold conditions, which could lead to a potential price reversal.
Volatility Analysis:
- Bollinger Bands (BB): The Bollinger Bands have been narrowing, indicating decreasing volatility and a possible period of consolidation.
- Bollinger Band %B (BBP): The %B indicator has been fluctuating within a tight range, signaling a lack of clear direction in price movement.
Volume Analysis:
- On-Balance Volume (OBV): The OBV indicator has been relatively stable, suggesting a balance between buying and selling pressure.
- Chaikin Money Flow (CMF): The CMF has been negative, indicating a slight outflow of money from the stock.
Conclusion:
Based on the analysis of the technical indicators, the stock FLGV is likely to experience sideways movement in the next few days. The trend indicators show a slightly bullish sentiment, while the momentum indicators suggest a possible reversal or consolidation phase. The volatility indicators point towards a period of low volatility and consolidation, while the volume indicators indicate a balanced market sentiment.
Considering all these factors, it is recommended to exercise caution and closely monitor the price action of FLGV in the coming days. Traders may consider implementing range-bound strategies, while investors may opt to wait for a clearer trend to emerge before making significant decisions.