Technical Analysis of FIXD 2024-05-10
Overview:
In analyzing the technical indicators for FIXD stock over the last 5 days, we will delve into the trend, momentum, volatility, and volume indicators to provide a comprehensive outlook on the possible stock price movement in the coming days. By examining these key indicators, we aim to offer valuable insights and predictions for potential investors.
Trend Indicators:
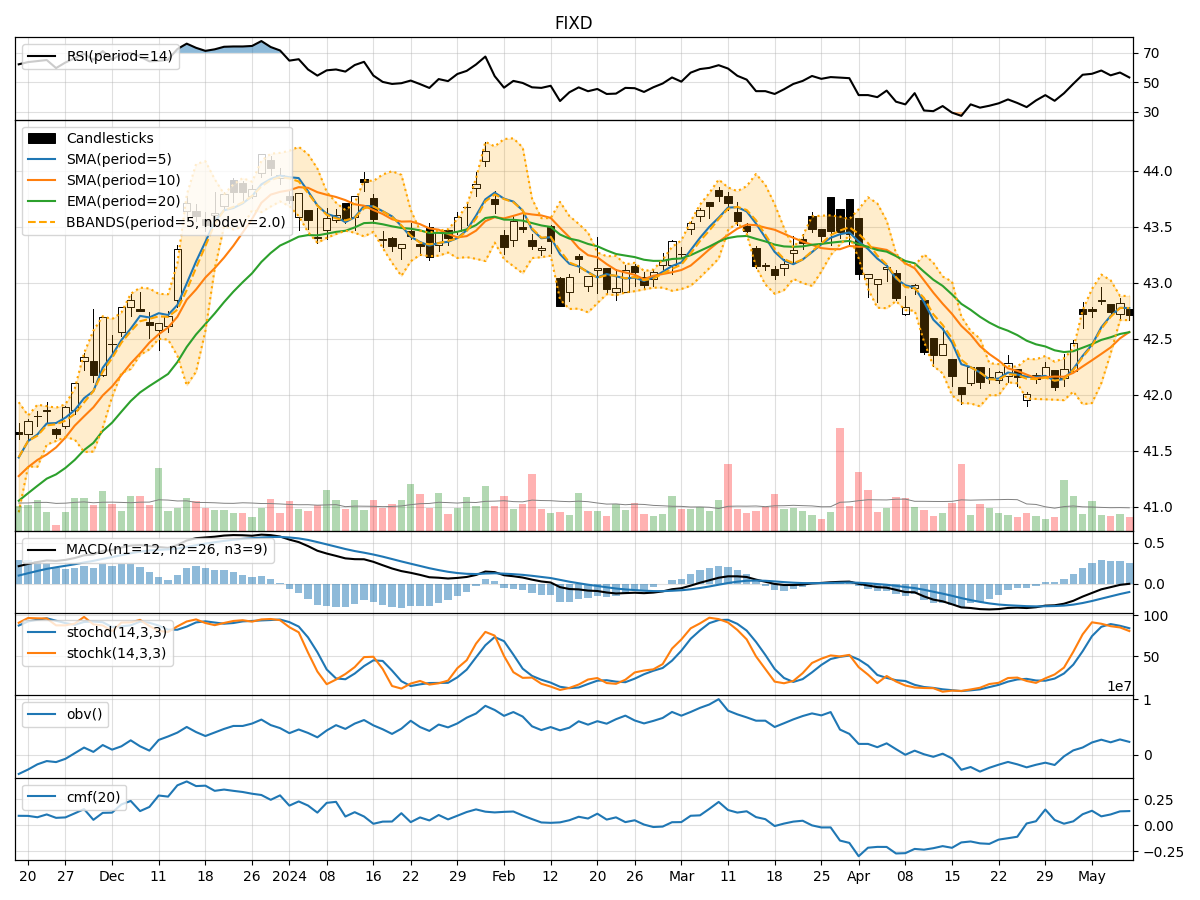
- Moving Averages (MA): The 5-day Moving Average (MA) has been relatively close to the closing prices, indicating a stable trend.
- MACD: The Moving Average Convergence Divergence (MACD) has shown a slight positive trend, with the MACD line crossing above the signal line.
- EMA: The Exponential Moving Average (EMA) has been slightly increasing, suggesting a bullish sentiment.
Momentum Indicators:
- RSI: The Relative Strength Index (RSI) has been fluctuating around the neutral zone, indicating a lack of strong momentum.
- Stochastic Oscillator: Both %K and %D have been declining, signaling a potential bearish momentum.
- Williams %R: The Williams %R is in the oversold territory, suggesting a possible reversal.
Volatility Indicators:
- Bollinger Bands: The Bollinger Bands have been narrowing, indicating decreasing volatility.
- Bollinger %B: The %B indicator is hovering around the middle, suggesting a balanced market sentiment.
Volume Indicators:
- On-Balance Volume (OBV): The OBV has shown mixed signals, with some days experiencing selling pressure.
- Chaikin Money Flow (CMF): The CMF has been positive, indicating buying pressure in the market.
Key Observations:
- The trend indicators suggest a slightly bullish sentiment, supported by the positive MACD and EMA trends.
- Momentum indicators show a lack of strong momentum, with the stochastic oscillator signaling a potential bearish phase.
- Volatility has been decreasing, indicating a possible period of consolidation.
- Volume indicators show mixed signals, with OBV reflecting selling pressure on certain days.
Conclusion:
Based on the analysis of the technical indicators, the stock price of FIXD is likely to experience sideways movement in the coming days. The slightly bullish trend indicators may be offset by the lack of strong momentum and potential bearish signals from the stochastic oscillator. The decreasing volatility and mixed volume signals further support the view of a consolidation phase. Investors should exercise caution and closely monitor the price action for any potential shifts in market sentiment.