Technical Analysis of FEZ 2024-05-10
Overview:
In analyzing the technical indicators for the FEZ stock over the last 5 days, we will delve into the trend, momentum, volatility, and volume indicators to provide a comprehensive outlook on the possible stock price movement in the coming days. By examining these key aspects, we aim to offer valuable insights and predictions to guide your investment decisions.
Trend Indicators:
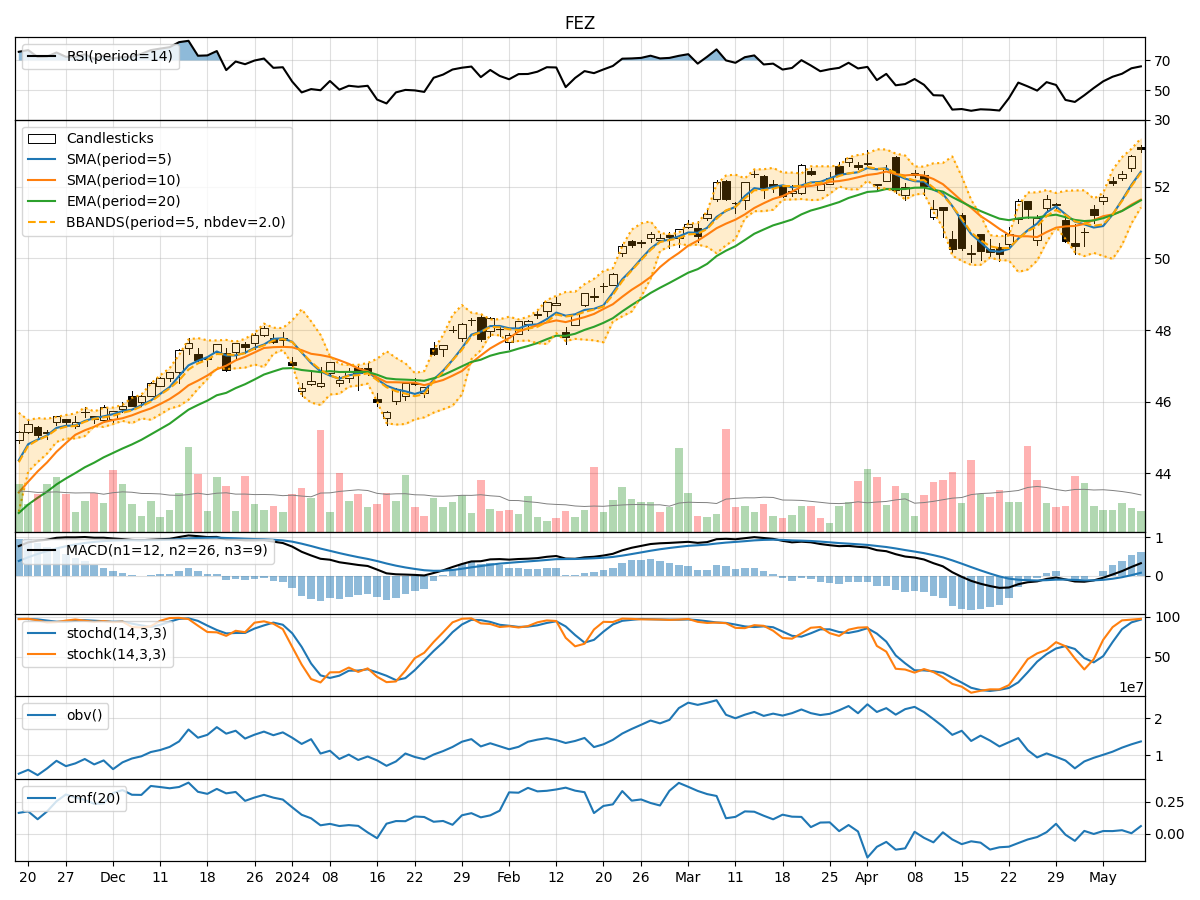
- Moving Averages (MA): The 5-day MA has been consistently rising, indicating a bullish trend in the short term.
- MACD: The MACD line has been above the signal line, suggesting a bullish momentum.
- EMA: The EMA has been trending upwards, supporting the bullish sentiment.
Key Observation: The trend indicators point towards a bullish outlook for the stock.
Momentum Indicators:
- RSI: The RSI has been increasing, but it is not in the overbought territory yet, indicating potential room for further upside.
- Stochastic Oscillator: Both %K and %D have been in the overbought zone, signaling strong buying momentum.
- Williams %R: The indicator is in the oversold region, suggesting a potential reversal to the upside.
Key Observation: Momentum indicators reflect a bullish sentiment with some signs of potential overbought conditions.
Volatility Indicators:
- Bollinger Bands: The stock price has been trading near the upper Bollinger Band, indicating increased volatility and a potential overbought condition.
- Bollinger %B: The %B indicator is above 0.8, suggesting the stock is trading at the upper range of its recent price action.
Key Observation: Volatility indicators imply a cautious stance due to the potential for a pullback from overbought levels.
Volume Indicators:
- On-Balance Volume (OBV): The OBV has been fluctuating, indicating mixed buying and selling pressure.
- Chaikin Money Flow (CMF): The CMF has been positive, suggesting accumulation in the stock.
Key Observation: Volume indicators show a neutral stance with a slight bias towards accumulation.
Conclusion:
Based on the analysis of the technical indicators, the overall outlook for the FEZ stock in the next few days is bullish with a potential for further upside momentum. However, given the overbought signals from some momentum and volatility indicators, a cautious approach is recommended, as a pullback or consolidation phase could occur before resuming the uptrend.
Key Conclusion: The stock is likely to experience upward movement in the near term, but investors should monitor for signs of potential reversal or correction due to overbought conditions in some indicators.