Technical Analysis of FELC 2024-05-10
Overview:
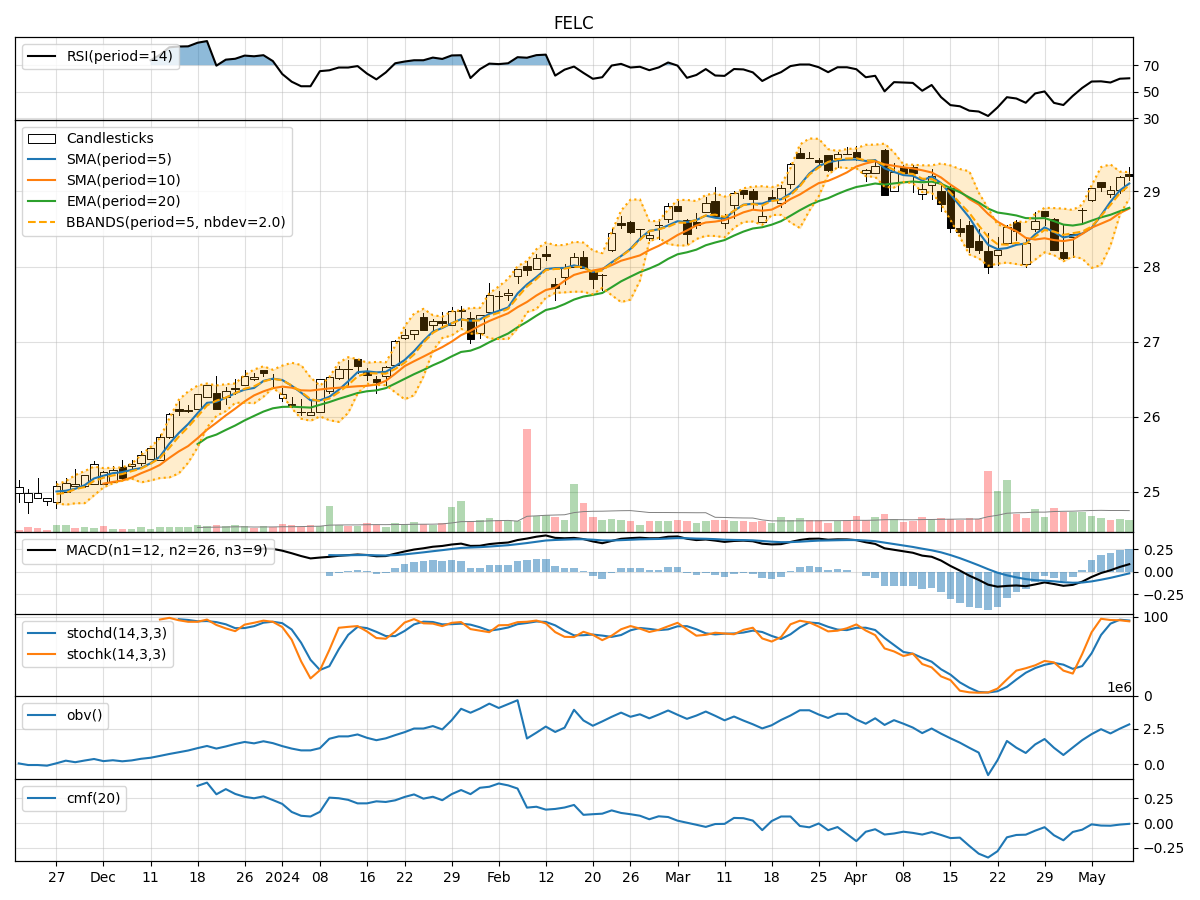
In analyzing the technical indicators for FELC over the last 5 days, we will delve into the trend, momentum, volatility, and volume indicators to provide a comprehensive outlook on the possible stock price movement in the coming days. By examining these key indicators, we aim to offer valuable insights and recommendations for potential investors.
Trend Indicators:
- Moving Averages (MA): The 5-day Moving Average (MA) has been consistently above the Simple Moving Average (SMA) and Exponential Moving Average (EMA), indicating a bullish trend.
- MACD: The MACD line has been consistently above the signal line, with the MACD histogram showing positive values, suggesting a bullish momentum.
Momentum Indicators:
- RSI: The Relative Strength Index (RSI) has been fluctuating around the 60-70 range, indicating a neutral momentum.
- Stochastic Oscillator: Both %K and %D have been in the overbought zone, suggesting a potential reversal or consolidation.
Volatility Indicators:
- Bollinger Bands: The stock price has been trading within the Bollinger Bands, with the bands narrowing, indicating decreasing volatility.
Volume Indicators:
- On-Balance Volume (OBV): The OBV has been relatively stable, showing no significant divergence from price movements.
- Chaikin Money Flow (CMF): The CMF has been negative, indicating selling pressure in the market.
Key Observations and Opinions:
- Trend: The trend indicators suggest a bullish sentiment in the short term.
- Momentum: The momentum indicators show a neutral to slightly overbought condition, signaling a potential consolidation phase.
- Volatility: Decreasing volatility implies a possible period of consolidation or sideways movement.
- Volume: The volume indicators do not show any significant divergence, indicating a lack of strong buying or selling pressure.
Conclusion:
Based on the analysis of the technical indicators, the next few days for FELC could see sideways movement or consolidation as the stock price may trade within a narrow range. Investors should exercise caution and wait for clearer signals before making significant trading decisions. It is advisable to monitor key levels and wait for confirmation of a new trend direction before taking any substantial positions.