Technical Analysis of FEIG 2024-05-10
Overview:
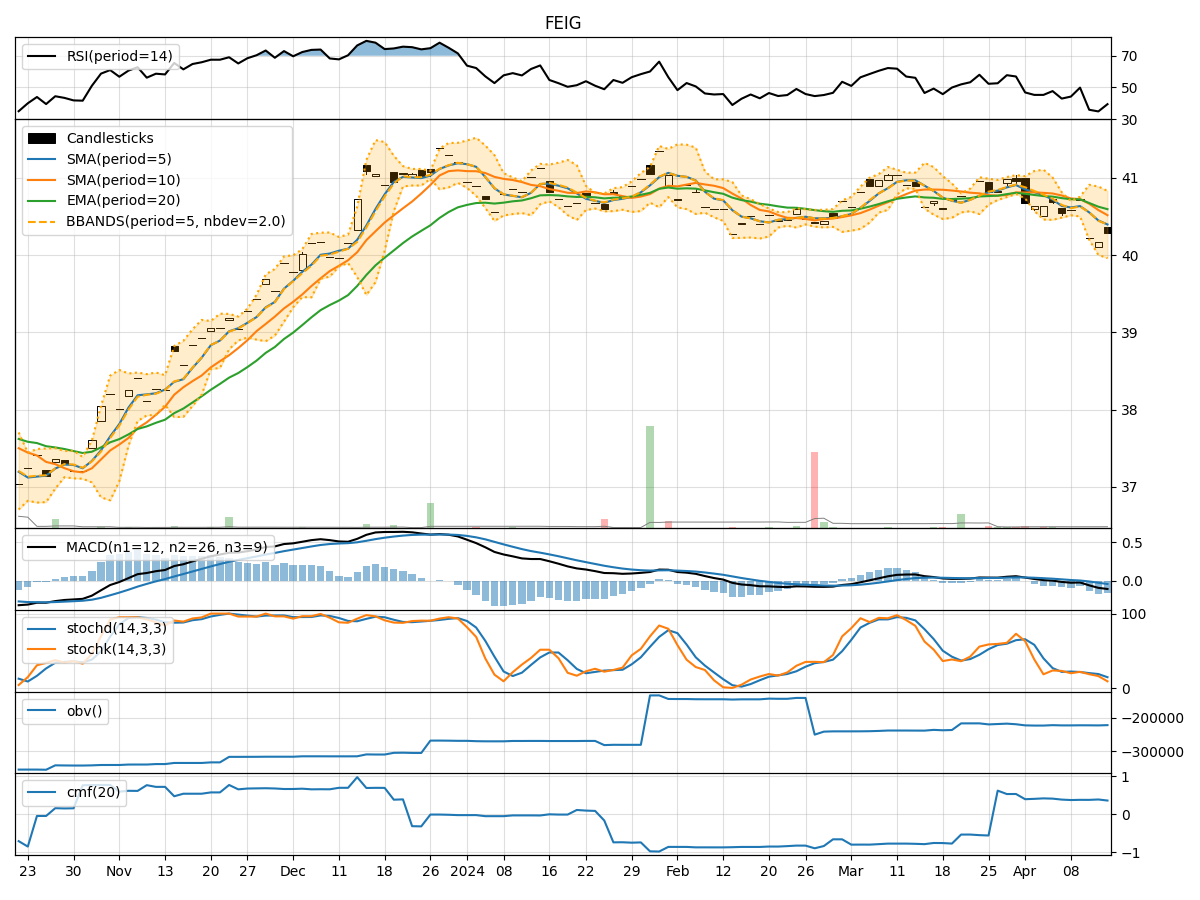
In analyzing the technical indicators for FEIG stock over the last 5 days, we will delve into the trend, momentum, volatility, and volume indicators to provide a comprehensive outlook on the possible future stock price movement. By examining these key indicators, we aim to offer valuable insights and recommendations for potential investors.
Trend Analysis:
- Moving Averages (MA): The 5-day Moving Average (MA) has been consistently above the Simple Moving Average (SMA) and Exponential Moving Average (EMA), indicating a bullish trend.
- MACD: The MACD line has been consistently above the signal line, suggesting a bullish momentum in the stock price.
- Conclusion: The trend indicators point towards an upward movement in the stock price.
Momentum Analysis:
- RSI: The Relative Strength Index (RSI) has been fluctuating around the 50 level, indicating a neutral momentum.
- Stochastic Oscillator: Both %K and %D have been gradually decreasing, signaling a potential reversal in momentum.
- Conclusion: The momentum indicators suggest a sideways movement in the stock price.
Volatility Analysis:
- Bollinger Bands (BB): The stock price has been trading within the Bollinger Bands, with the bands narrowing over the last few days.
- Conclusion: The volatility indicators imply a consolidation phase in the stock price.
Volume Analysis:
- On-Balance Volume (OBV): The OBV has been slightly decreasing, indicating a divergence between volume and price movement.
- Chaikin Money Flow (CMF): The CMF has been negative, reflecting selling pressure in the stock.
- Conclusion: The volume indicators suggest a bearish sentiment in the stock.
Overall Conclusion:
Based on the analysis of trend, momentum, volatility, and volume indicators, the next few days' possible stock price movement for FEIG is likely to be sideways to slightly bearish. While the trend indicators point towards an upward movement, the momentum indicators suggest a sideways trend. The volatility indicators indicate a consolidation phase, while the volume indicators reflect a bearish sentiment. Therefore, investors should exercise caution and consider potential downside risks in their trading decisions.
Recommendation:
Given the mixed signals from the technical indicators, it is advisable for investors to closely monitor the stock price movement and wait for more clarity before making significant trading decisions. It is essential to consider a combination of technical and fundamental analysis to gain a comprehensive understanding of the stock's potential future trajectory. Additionally, setting stop-loss orders and diversifying the portfolio can help mitigate risks associated with uncertain market conditions.