Technical Analysis of FEDL 2024-05-10
Overview:
In analyzing the technical indicators for FEDL over the last 5 days, we will delve into the trend, momentum, volatility, and volume indicators to provide a comprehensive outlook on the possible stock price movement in the coming days. By examining these key indicators, we aim to offer valuable insights and predictions for informed decision-making.
Trend Indicators:
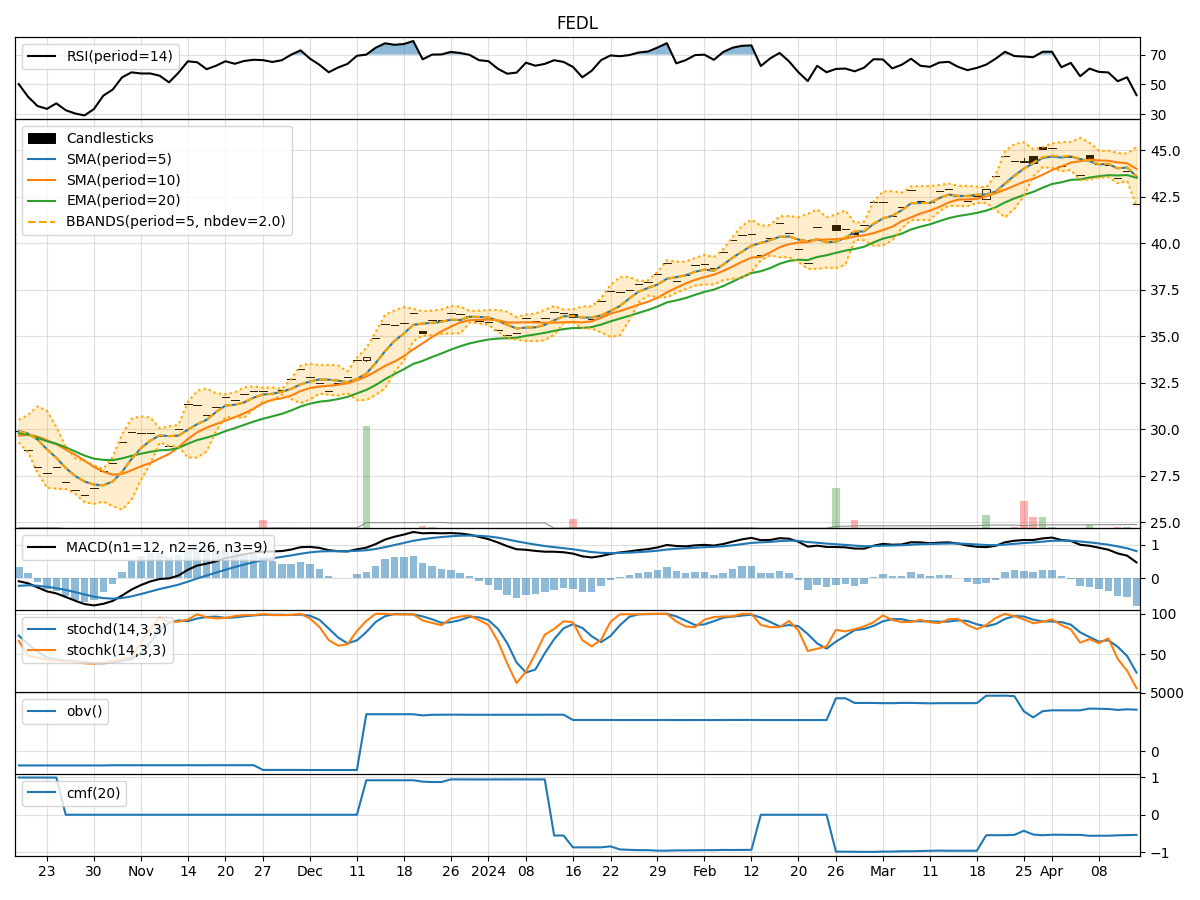
- Moving Averages (MA): The 5-day moving average has been consistently rising, indicating a bullish trend in the short term.
- MACD (Moving Average Convergence Divergence): The MACD line has been increasing, crossing above the signal line, suggesting a strengthening bullish momentum.
- EMA (Exponential Moving Average): The EMA has been on an upward trajectory, supporting the bullish trend.
Key Observation: The trend indicators point towards a strong bullish sentiment in the stock price movement.
Momentum Indicators:
- RSI (Relative Strength Index): The RSI is in the neutral zone, indicating potential room for further upside without being overbought.
- Stochastic Oscillator: Both %K and %D lines of the Stochastic Oscillator are in the overbought territory, suggesting a potential pullback.
- Williams %R (Willams Percentage Range): The Williams %R is in the oversold region, signaling a possible reversal to the upside.
Key Observation: The momentum indicators present a mixed signal, with the potential for a short-term pullback before resuming the bullish momentum.
Volatility Indicators:
- Bollinger Bands: The stock price has been trading within the upper Bollinger Band, indicating an overbought condition.
- Bollinger Band Width: The Band Width has been narrowing, suggesting a decrease in volatility.
Key Observation: The volatility indicators suggest a potential consolidation or a minor retracement in the stock price.
Volume Indicators:
- On-Balance Volume (OBV): The OBV has been relatively flat, indicating a balance between buying and selling pressure.
- Chaikin Money Flow (CMF): The CMF is at zero, reflecting a lack of significant money flow into the stock.
Key Observation: The volume indicators imply a lack of strong buying or selling pressure in the stock.
Conclusion:
Based on the analysis of the technical indicators, the next few days' possible stock price movement for FEDL is likely to experience a short-term pullback due to the overbought conditions indicated by the momentum and volatility indicators. However, the overall trend remains bullish, supported by the moving averages and MACD. Traders should be cautious of a potential retracement or consolidation phase before the uptrend resumes.
Recommendation:
- Short-term Traders: Consider taking profits or setting stop-loss orders to protect gains during the expected pullback.
- Long-term Investors: Use any dips as buying opportunities to capitalize on the overall bullish trend in FEDL.
Always remember to monitor the market closely and adjust your strategy based on real-time price action and updated technical indicators for a well-informed investment decision.