Technical Analysis of FEBZ 2024-05-10
Overview:
In analyzing the technical indicators for FEBZ stock over the last 5 days, we will delve into the trend, momentum, volatility, and volume indicators to provide a comprehensive outlook on the possible stock price movement in the coming days. By examining these key indicators, we aim to offer valuable insights and predictions to guide investment decisions.
Trend Indicators:
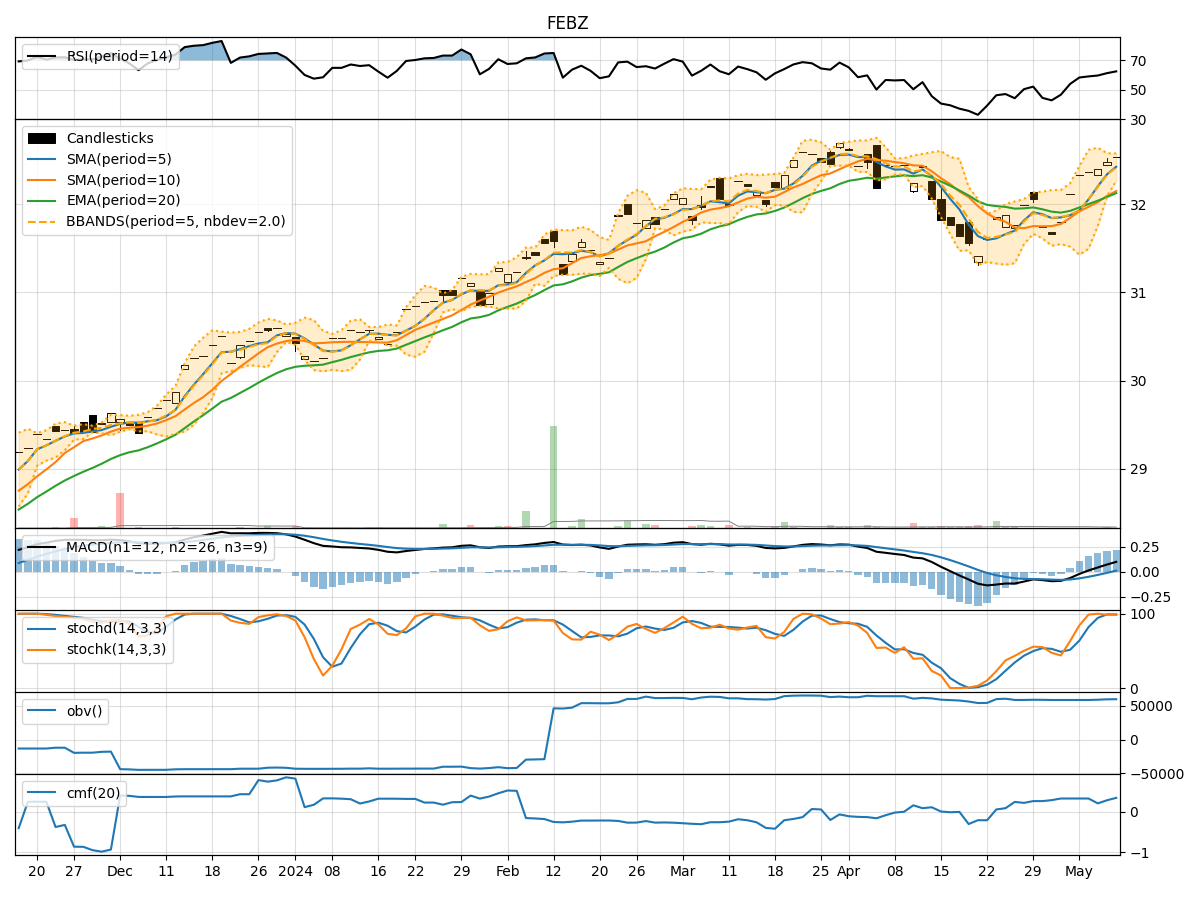
- Moving Averages (MA): The 5-day Moving Average has been consistently rising, indicating a bullish trend in the short term.
- MACD: The MACD line has been trending upwards, crossing above the signal line, suggesting a bullish momentum.
- EMA: The Exponential Moving Average has also been on an upward trajectory, supporting the bullish trend.
Momentum Indicators:
- RSI: The Relative Strength Index has been increasing, showing strengthening buying momentum.
- Stochastic Oscillator: Both %K and %D have been in the overbought zone, indicating a strong bullish momentum.
- Williams %R: The indicator has been hovering around the oversold territory, suggesting a potential reversal to the upside.
Volatility Indicators:
- Bollinger Bands: The bands have been narrowing, indicating decreasing volatility and a possible period of consolidation.
- Bollinger %B: The %B indicator has been gradually increasing, signaling a potential bullish breakout.
Volume Indicators:
- On-Balance Volume (OBV): The OBV has been steadily increasing, reflecting strong buying pressure.
- Chaikin Money Flow (CMF): The CMF has been positive, indicating that money is flowing into the stock.
Key Observations and Opinions:
- Trend: The stock is in a clear upward trend supported by moving averages and MACD.
- Momentum: Momentum indicators suggest a strong bullish sentiment with potential for further upside.
- Volatility: Bollinger Bands tightening indicates a potential consolidation phase before a breakout.
- Volume: Increasing OBV and positive CMF point towards sustained buying interest in the stock.
Conclusion:
Based on the analysis of the technical indicators, the next few days for FEBZ stock are likely to see continued upward movement. The bullish trend, supported by strong momentum and positive volume flow, suggests that the stock price is poised for further gains. Traders and investors may consider buying opportunities in anticipation of a potential bullish breakout.